Network
OT Security monitors all activity in you network. This information is displayed in the Network section of the UI.
The Network data is shown on three screens.
-
Network Summary– shows an overview of the network activity.
-
Packet Captures – shows a listing of the PCAP files captured by the system.
-
Conversations – shows a list of all conversations detected in the network, with details about the time that it occurred, involved assets etc.
Network Summary
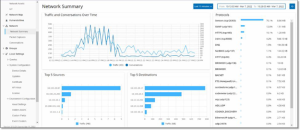
The Network Summary screen shows visual graphs that summarize the network activity. You can set the time frame for which the data is displayed. You can also interact with the widgets to show additional details.
The screen includes four widgets:
-
Traffic and Conversations over Time – a graph displaying the amount of traffic in GB/MB and the number of conversations taking place in the network.
-
Top 5 sources – a column bar graph displaying the five source assets that initiated the most network activity. For each source, the graph displays bars representing the amount of traffic. When you hover the cursor over the graph, the number of conversations is shown in a tooltip.
-
Top 5 destinations – a column bar graph displaying the five destination assets that received the most network activity. For each destination, the graph displays bars representing the amount of incoming traffic. When you hover the cursor over the graph, the number of conversations is shown in a tooltip.
-
Protocols – a bar graph displaying the communication protocols used in the network, ordered by frequency. For each protocol, the graph displays the rate at which it was used (as a percentage of the total traffic) and the volume of traffic.
Setting the Time Frame
All data displayed on the Network screen represents activity in the network during a specified time frame. The range of time for which data is currently displayed is shown in the header bar. The default time frame is set for the Last 15 minutes. The Start and End times of the selected time frame are displayed in the header bar.
To Set the Time Frame:
-
Click on Time Frame Selection in the header bar (default Last 15 Minutes).
A dropdown menu with time frame options is displayed.

-
Select a time range using one of the following methods
-
Select a preset time range by clicking on the desired range (options are: Last 15 Minutes, Last 1 Hour, Last 4 Hours, Last 12 Hours, Last Day, Last 7 Days or Last 30 Days), OR
-
Set a custom time range using the following procedure:
-
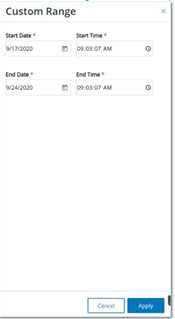
Click Custom Range.
The Custom Range window is displayed.
-
Enter the Start Date and Start Time and the End Date and End Time in the appropriate fields.
-
Click Apply.
The time frame is set. The start date and time and end and time are shown in the header bar next to the time frame selection. The screen is refreshed to show only data for the selected time frame.
-
-
Traffic and Conversations over Time
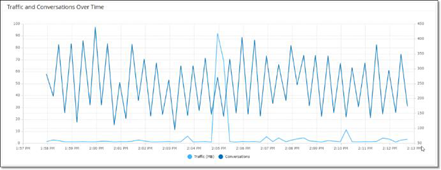
A line graph displays the amount of traffic (measured in KB/MB/GB) and the number of conversations that took place in the network over time. The display key is shown on the top of the graph.
To Display Data for a specific time segment:
-
Hover over a point on the graph to display a pop-out window with specific data about the traffic and conversations that took place during that time segment.
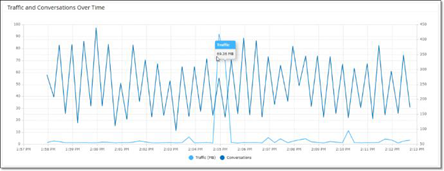 Note: The length of the time segment shown is adjusted according to the time scale being displayed (e.g. for a 15-minute time frame data is shown for each minute separately but for a 30-day time frame it is shown for 6 hr. segments).
Top 5 Sources
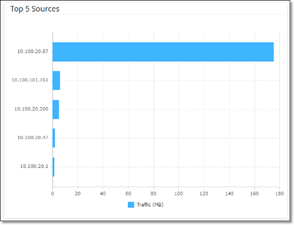
The Top 5 Sources pane shows the number of conversations and amount of traffic for each of the top 5 assets that sent communications through the network during the specified time frame. The source assets are identified by their IP addresses. Hovering over a bar graph shows the number of conversations and amount of traffic sent from that asset.
Top 5 Destinations
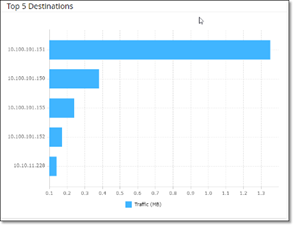
The Top 5 Destinations pane shows the number of conversations and amount of traffic for each of the top 5 assets that received communications through the network during the specified time frame. The destination assets are identified by their IP addresses. Hovering over a bar graph shows the number of conversations and amount of traffic received by that asset.
Protocols
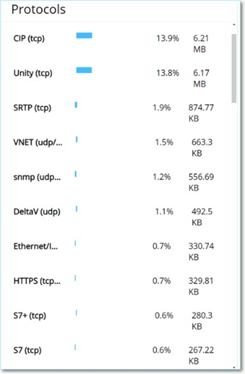
The Protocols pane shows data about the usage of various protocols for communication within the network during the specified time frame. The protocols are listed from most used (on top) to least used (at the bottom). For each protocol the following information is displayed:
-
A bar graph showing the rate of usage (with a full bar indicating the top usage and partial bars indicating the extent of usage relative to the top used protocol)
-
The percentage of usage
-
Total volume of communication
