Policy Violations
Use the Policy Violations page to view all the events associated with the same policy, source, and destination. Each finding on the page is an aggregation of multiple events resulting from the same policy hits sharing the same source and destination.
To access the Policy Violations page:
-
In the left navigation menu, click Risks > Findings.
The Findings page appears.
-
Click the Policy Violations tab.
The Policy Violations page appears with the list of events.
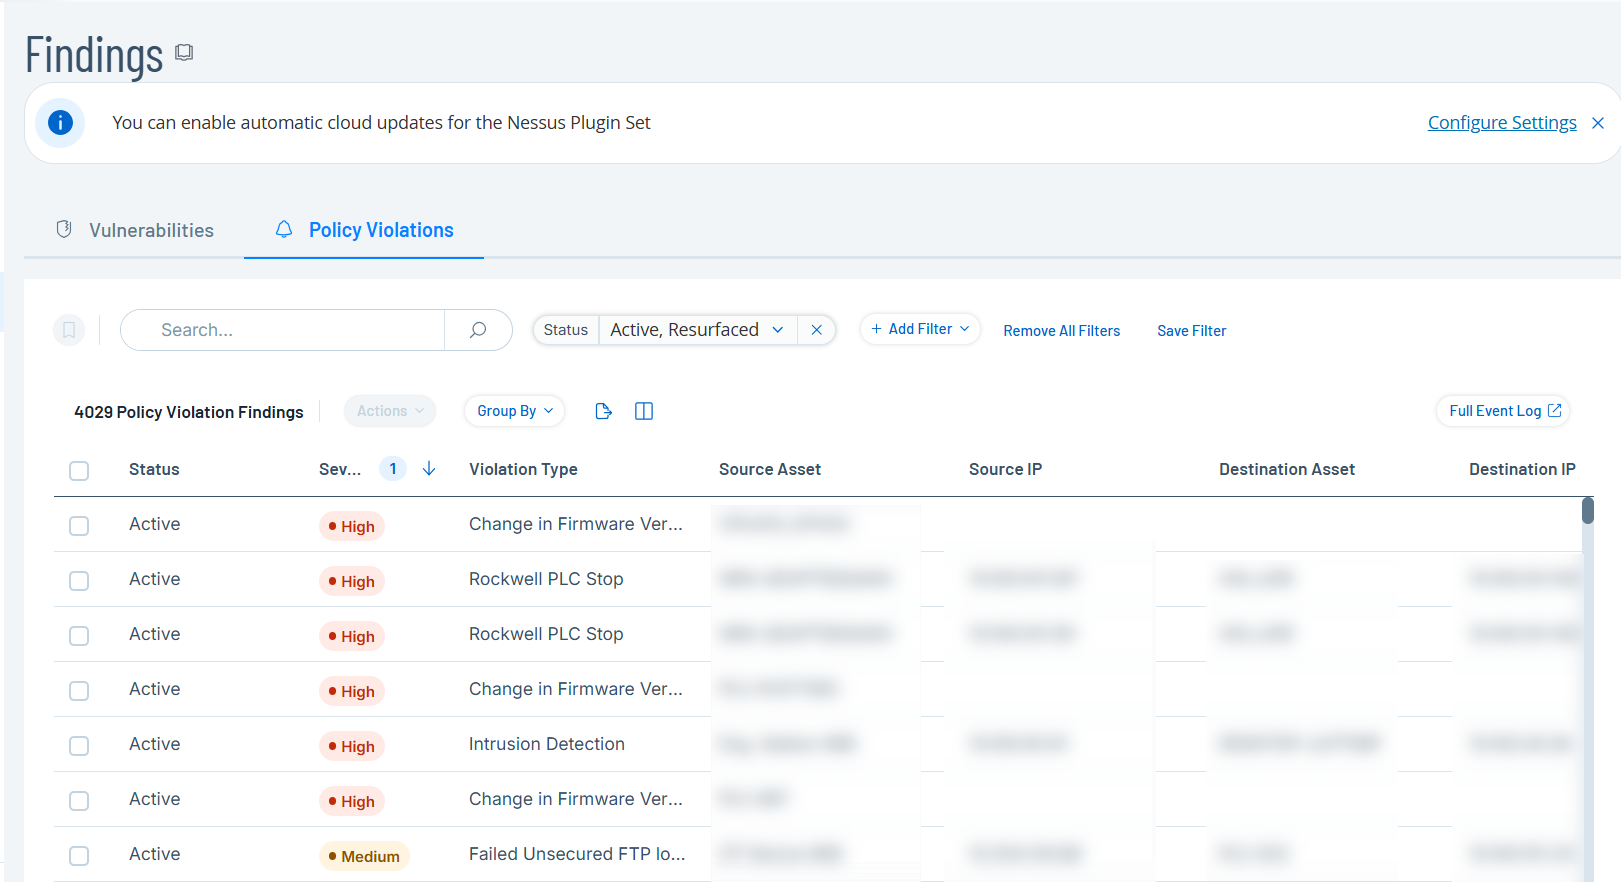
The Policy Violations tab includes the following details:
Column Description ID The ID of the violation. Status The status of the violation: Active, Resurfaced, or Resolved. Severity The severity of the violation: High, Medium, or Low. Violation Type The type of violation. For example, Unauthorized Conversation and Intrusion Detection. Violation Category The category that the violation type belongs to. Policy The policy that caused the violation. Plugin Name The plugins associated with the violation. Mitre ICS Tactics The reason or "why" behind a specific Mitre Attack technique for Industrial Control Systems (ICS). Mitre ICS Techniques The method or the "how" an adversary achieves a tactical goal. Source Asset The asset where the violation originated. Source IP The IP address of the source asset. Destination Asset The asset where the violation terminated. Destination IP The IP address of the destination asset. Protocol The protocol associated with the violation. First Hit The time when the violation was first detected. Last Hit The time when the violation was last detected. Active Hits The number of events resulting in the violation. Asset Type The type of asset where the violation was detected. Asset Critical The criticality of the asset. Asset Vendor The vendor associated with the asset. Asset Family The family that the asset belongs to. Asset Tags The tags associated with the asset. Purdue Level The purdue level of the asset. Asset Location The region where the asset is located. Resolved On The date when the violation was resolved. Resolved By The user who resolved the violation. Comment The comments added by the user when resolving the violation. -
(Optional) You can do the following on the Violations page:
-
Customize columns as described in Customize Tables.
-
Filter the findings table. See Filter tables.
-
Export the data in the CSV format.
-
View Policy Violation Details
To view the policy violation details:
-
In the left navigation menu, click Risks > Findings.
The Findings page appears.
-
Click the Policy Violations tab.
The Policy Violations tab appears.
-
Do one of the following:
-
Click the policy violation row for which you want to view the details.
-
In the row of the policy violation, click the
 icon and select View.
The Policy Violation details panel appears. The panel shows the details of the violation in four separate tabs: Details, Source, Destinations, Policy
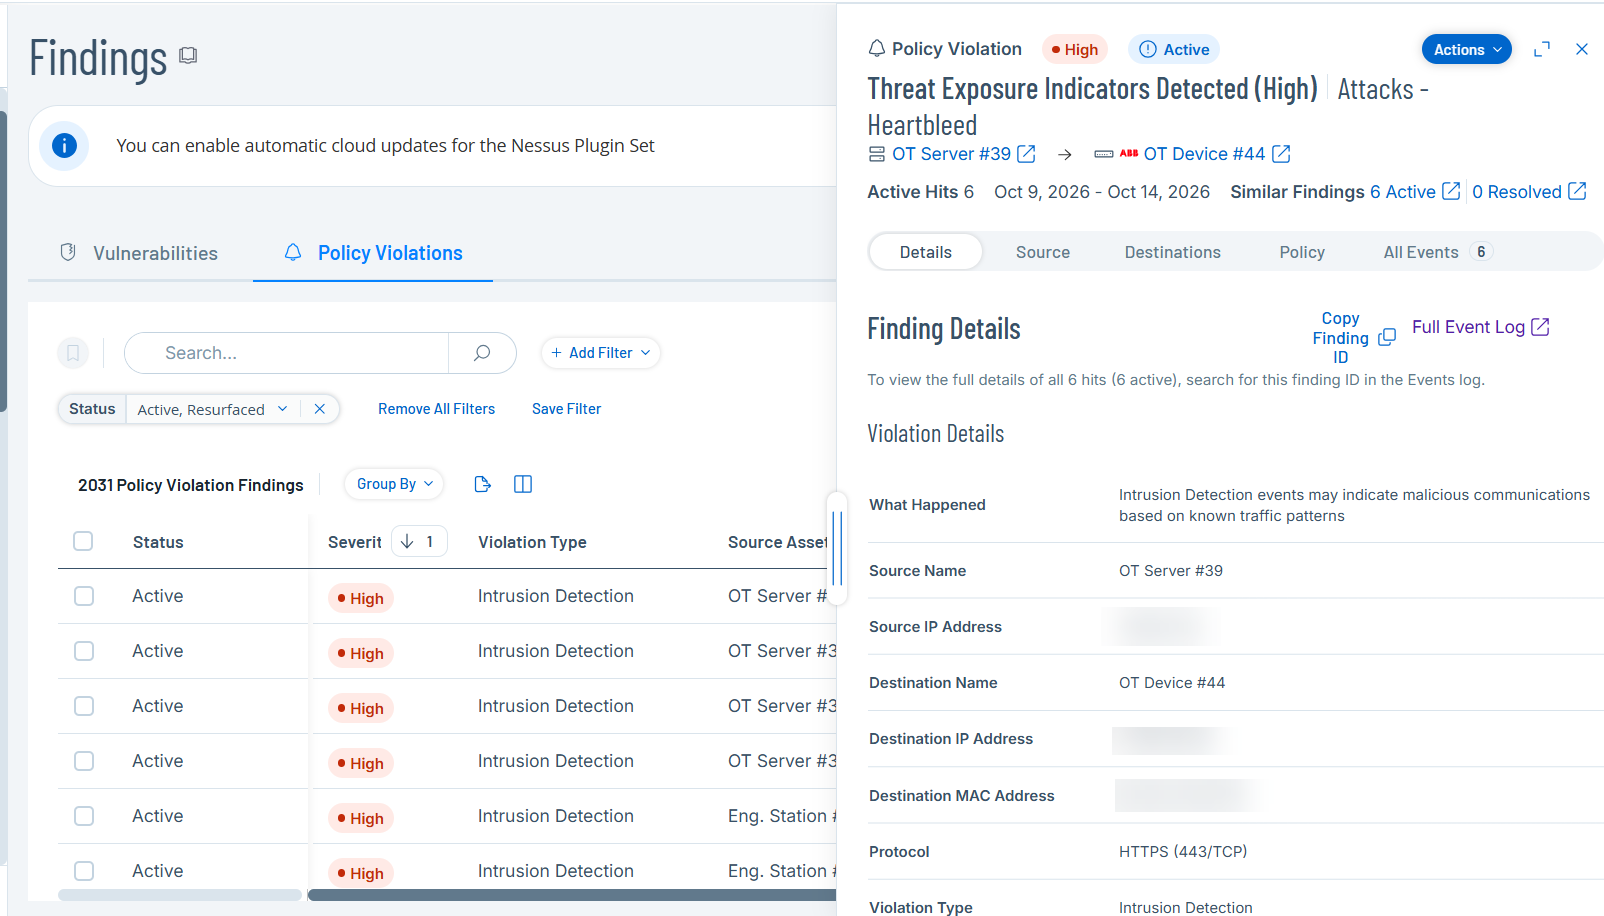
Tab Description Details Displays the violation details (What Happened, Source/Destination Name, IPs, MAC, Protocol, Violation Type, Violation Category, Policy Hits, First Hit, Last Hit, Last Hit Rule Message, Last Hit SID). It also includes details on its importance, suggested mitigation, and plugin details. Source Displays the source asset details, such as Name, Type, Risk Score, IPs, Asset Criticality, Purdue Level and View Full Asset Details link, which redirects you to the Asset Details panel on the Inventory page. Destinations Displays the destination asset details, such as Name, Type, Risk Score, IPs, MACs, Asset Criticality, Vendor, Purdue Level, and View Full Asset Details link, which redirects you to the Asset Details panel on the Inventory page. Policy Displays the linked policy configuration and includes details such as the Policy Name, Take Snapshot After Hit, Disable After Hit, Severity, Source scope, Destination or Affected Asset scope, Schedule. This tab also includes the View and Manage Full Policy Details link, which opens the specific Policies page. All Events Displays the list of events on that specific event type. Click each event to view more context about the generated finding. Click the Actions menu and choose one of the actions: Resolve, Exclude from Policy, or Download Last Capture File. Copy Finding ID 
Available on the Details tab. Use this to copy the finding ID to search for the specific event on the All Events page. Full Event Log 
Available on the Details tab. Click this to open the All Events page.
-
Actions menu
Resolve a finding
-
To resolve a finding:
-
Do one of the following:
-
In the row of the finding, click the
button and select Resolve. -
Click the finding row to open the Policy Violations panel. In the Policy Violations panel, click Actions > Resolve.
-
-
Type a comment for resolving the finding.
-
Click Save.
Tenable One OT Exposure resolves the finding and the Plugin Details panel shows the status as Resolved.
Note: If the event reoccurs, Tenable One OT Exposure reopens the finding and status appears as Resurfaced.
-
Exclude from policy
-
To exclude the finding from a policy:
-
Do one of the following:
-
In the row of the finding, click the
button and select Exclude from Policy. -
Click the finding row to open the Policy Violations panel. In the Policy Violations panel, click Actions > Exclude from Policy.
-
-
Select the Exclude Conditions.
Note: The exclude conditions are based on the last and most recent event. -
Provide the Exclusion Description.
-
Click Save.
Tenable One OT Exposure excludes the most recent event from the policy.
-
Download last capture file
To download the last capture file:
-
Do one of the following:
-
In the row of the finding, click the
button and select Download Last Capture File. -
Click the finding row to open the Policy Violations panel. In the Policy Violations panel, click Actions > Download Last Capture File.
-
Plugin Details
To view the details of the plugin for the finding:
-
In the Policy Violations tab, click the row of the finding to view its plugin details.
The plugin details panel appears with the violation details from the Tenable One OT Exposure plugin page.
The panel shows the details of the violation in four separate tabs: Details, Source, Destinations, Policy
Search for Events
To search for specific events that caused the violation:
-
To find the events for a specific finding, click
 Copy Finding ID.
-
To go to the Events page, click the Full Event Log
link.The All Events page appears.
-
In the Search box, paste the Finding ID that you copied earlier.
Tenable One OT Exposure lists the events for the specific finding.