Dashboards
There are three dashboards: Risk, Inventory, and Events and Policies. The dashboards contain widgets that offer an at-a-glance view of your network’s inventory and security posture.
To select a dashboard:
In the main navigation menu, click Dashboards.
The Risk dashboard is the initial default view; however, you can change the default view to a different dashboard.
You can interact with dashboards by adjusting the display settings and setting filters, see Interacting with Dashboards.
Risk Dashboard
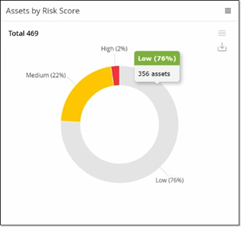
The Risk dashboard provides insights on the network’s cyber exposure by looking into asset risk scores and vulnerability management metrics.
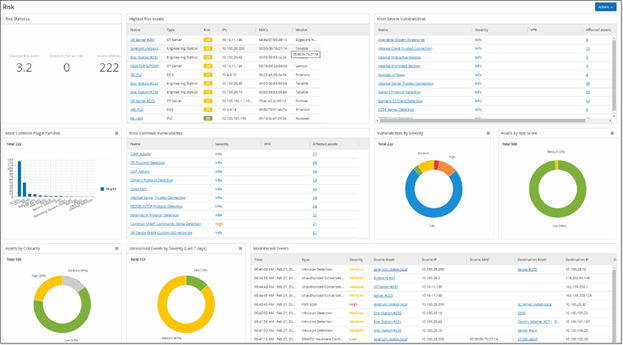
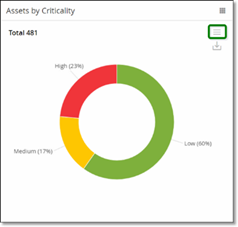
The Risk dashboard shows widgets such as: Risk Statistics, Assets by Risk Score, Assets by Criticality, Events by Severity, Most Common Vulnerabilities, and so on.
Clicking an asset or vulnerability link takes you to the corresponding element on the Inventory or Vulnerabilities screen, respectively.
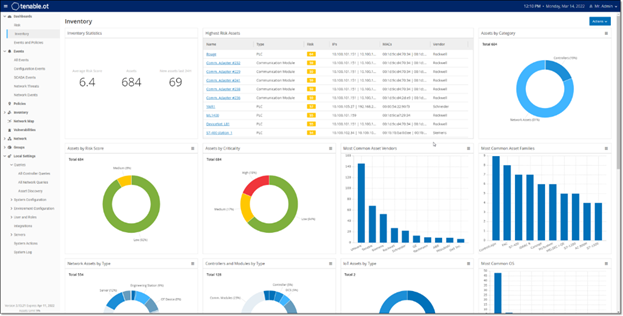
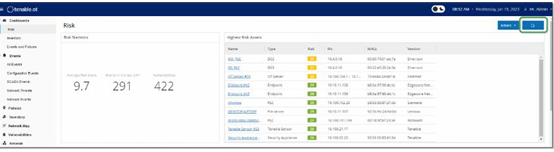
Inventory Dashboard
The Inventory dashboard provides visibility into the asset inventory, facilitating asset management, and tracking.
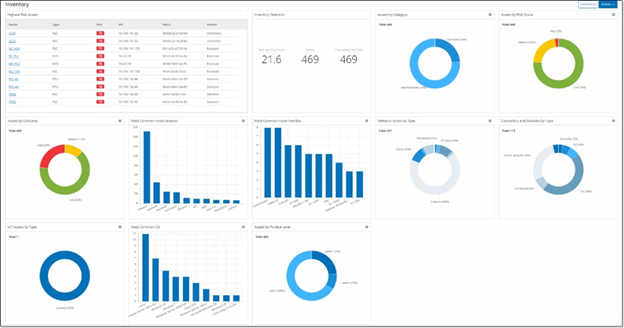
The Inventory dashboard shows widgets such as: Highest Risk Assets, Inventory Statistics, Assets by Risk, Controllers, and Modules by Type, Assets by Purdue Level and so on.
Clicking an asset link takes you to the corresponding asset on the Inventory screen.
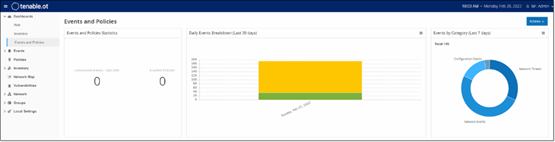
Events and Policies Dashboard
The Events and Policies dashboard provides a means to detect network threats by monitoring the identified events and the policies violations that they generate.

The Events and Policies dashboard shows widgets such as: Daily Events Breakdown, Events and Policies Statistics, Events Status, Most Common Event Destinations and so on.
Clicking an asset or event link takes you to the corresponding element in the Inventory or Events screens respectively.
Interacting with Dashboards
You can adjust the dashboard display by interacting with widgets. There are two modes for showing data on the dashboards: Graph mode and Table mode. Some widgets have a fixed display mode, while others allow you to toggle them between modes. Widgets with a symbol in the upper-right corner appear in graph mode or table mode. Click on the table/graph symbol to toggle between modes.
Graph mode
Graph mode shows a graphic visualization of the widget data.
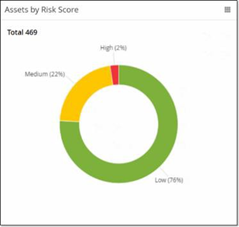
You can interact with the widgets in the following ways:
Hover over a point on the graph to display a window with data specific to that segment of the graph.
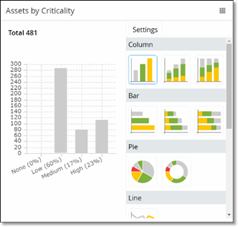
You can adjust the type of chart used for the display by clicking on Settings button in the top-right corner.
You can select one of the other chart types from the Settings menu.
When viewing a widget in graph mode, you can download an image of the graph by hovering over the widget and clicking the Download icon.
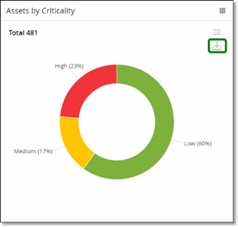
Table mode
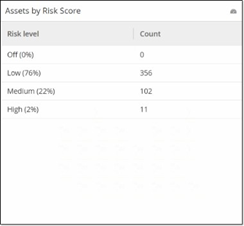
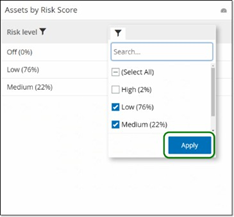
When viewing a widget in table mode you can filter each column by hovering over the column header, clicking on the filter icon, choosing your filters, and clicking Apply. The filters also apply to the graph if you switch to graph mode.
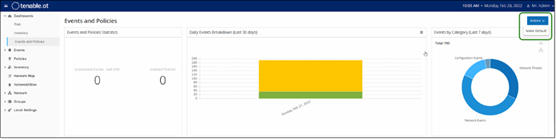
Changing the Default Dashboard
The Risk dashboard is the initial default view of the Management Console. You can designate a different dashboard to be shown as the default view.
To change the default dashboard view:
Navigate to the dashboard to use as the default view.
Click Actions > Make default.
OT Security updates the default dashboard and shows it the next time you access the Management Console
The Export button of the Dashboard screen exports a PDF with each Dashboard widget on a separate page.
To export the Dashboard:
In the upper-right corner of the Dashboard, click Export.
The PDF downloads automatically to the default download folder.
Note: Make sure to leave the Dashboard tab open in your browser while the PDF download is in progress (2-3 seconds).
After the file download completes, navigate to the downloaded file to view or share it.