Dashboards

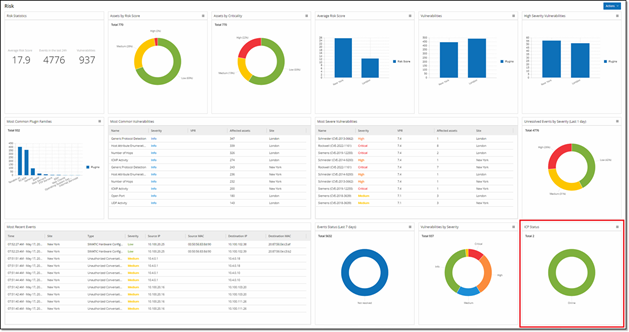
The dashboards contain widgets that offer an at-a-glance view of aggregated information related to your whole enterprise’s inventory and security posture based on information collected from all of your Sites. In addition to the standard widgets that are shown for individual Sites, the EM dashboards contain an ICP Status widget that displays the connectivity status of each of your Sites.
The following dashboards can be viewed:
-
Risk - provides insights on your entire enterprise’s cyber exposure by looking into asset risk scores and vulnerability management metrics. The Risk dashboard displays aggregated data in widgets such as: Risk Statistics, Assets by Risk Score, Assets by Criticality, Average Risk Score, Vulnerabilities etc.
-
Inventory - provides visibility into the entire enterprise’s asset inventory, facilitating asset management and tracking. The Inventory dashboard displays aggregated data in widgets such as: Inventory Statistics, Assets, Assets by Category, Controllers and Modules by Type, Assets by Purdue Level etc.
-
Events and Policies - provides a means to detect threats to the enterprise by monitoring the identified events and the policies violations that they generate. The Events and Policies dashboard displays aggregated data in widgets such as: Events and Policies Statistics, Hourly Events Breakdown, High Severity Events, Events Status etc.
The Risk dashboard is the initial default view; however, you can change the default view to a different dashboard by clicking on the Actions button in the upper-right corner.
You can interact with dashboards by adjusting the display settings and setting filters, see Interacting with Dashboards in OT Security User Guide.