Tenable One OT Exposure EM Overview
The Overview page features widgets that offer an at-a-glance view of your complete enterprise inventory and security posture. Tenable One OT Exposure EM aggregates data from all sites and displays it in widgets. Along with the standard widgets for individual sites, the EM Overview page includes an ICP Status widget showing each site's the connectivity status.
To access the Overview page:
-
In the left hand navigation bar, click Overview.
The Tenable One OT Exposure EM Overview page appears.
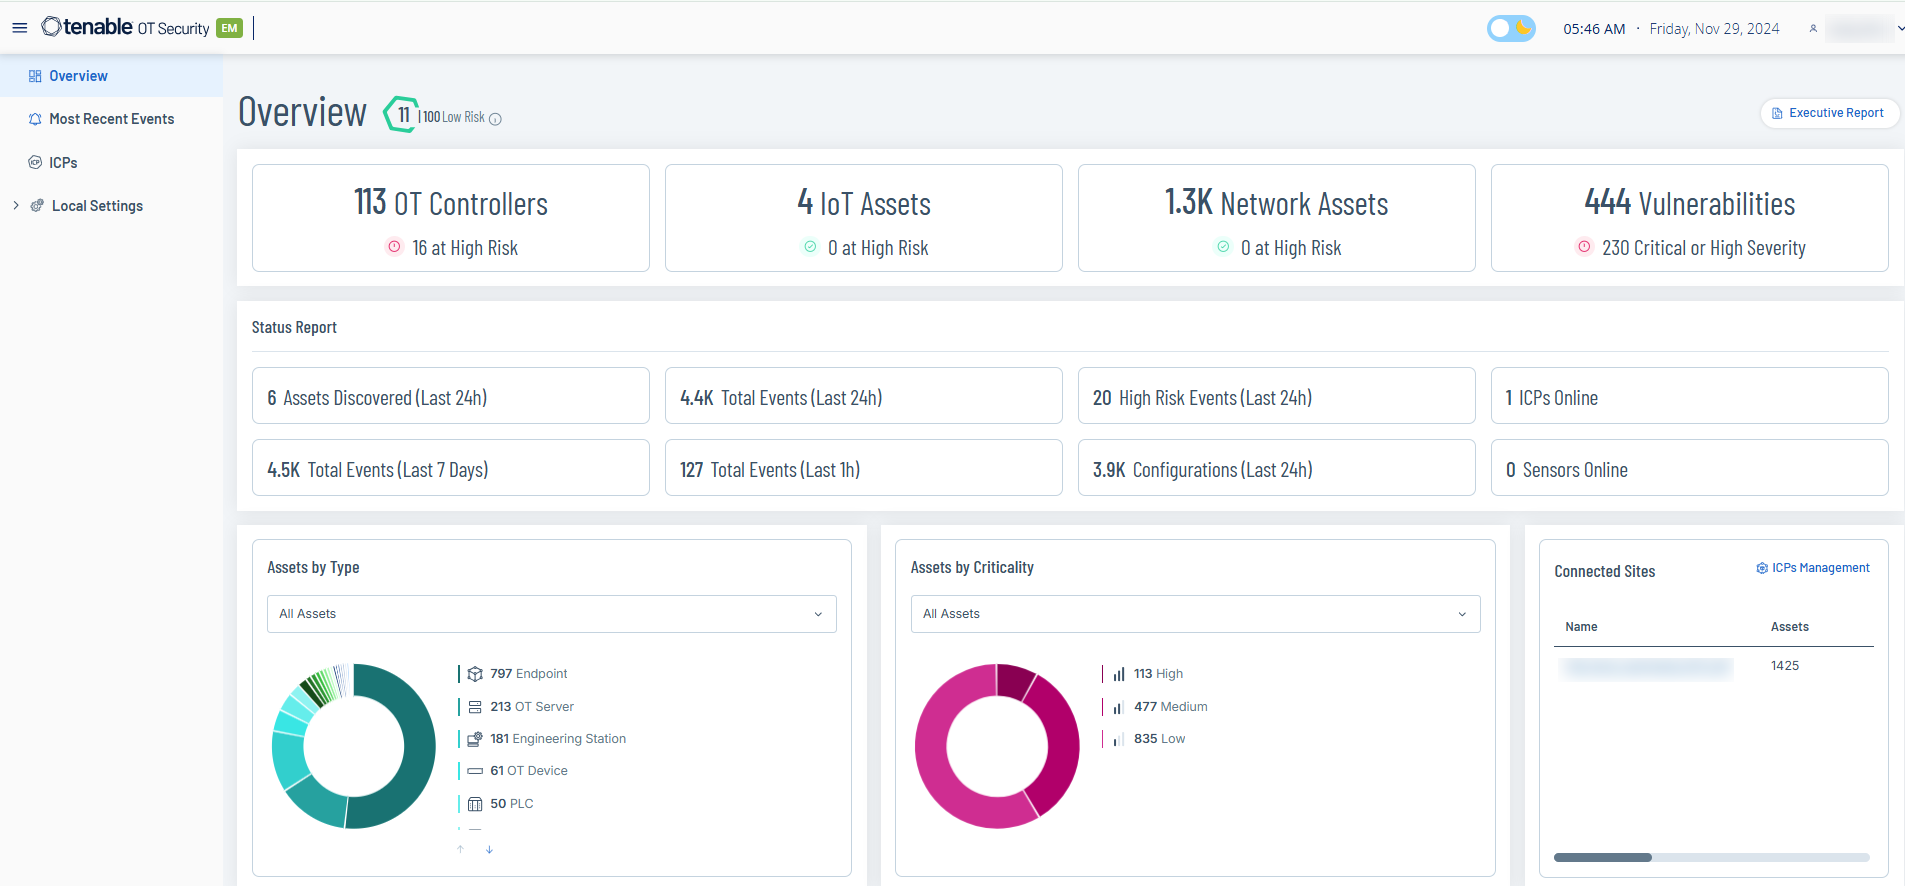
The Overview page includes the following widgets:
| Widget | Description |
|---|---|
| Risk Score |
The Average Risk Score is the average of all asset scores in your environment. To view a breakdown of the score, hover over the value. The Average Risk Score uses the following color codes to indicate the severity of the risk:
Tenable One OT Exposure calculates the asset scores based on the following factors that changes with time (decaying events, firmware, and state changes):
|
| Executive Report | Click this link to generate a risk assessment report for your environment based on the data from the last 30 days. The report opens on your browser. To download the report as PDF, click Save as PDF at the top of the page. |
| Assets and Vulnerabilities | The current state of assets and vulnerabilities in your environment. Includes separate widgets for each asset type (OT Controllers, Network Assets, IoT Assets) that show the number of assets in that category and the number of assets that are at high risk. |
| Status Report | The overall status of your environment, such as assets discovered, total events, number of high risk events, number of configuration events in the last 24 hours. The widget also shows the number of ICPs and sensors that are online. The widget also includes total events in the last 7 days and in the last one hour. |
| Assets by Type | The number of assets by type, such as endpoint, PLC, and OT device. |
| Assets by Criticality | The number of assets by their criticality: High, Medium, or Low. |
| Connected Sites |
Lists the ICPs connected to the EM. The widget includes the following details:
To open the ICPs page, in the upper-right corner, click ICPs Management. |