Essential Eight Vulnerability Management Dashboards
The Essential Eight Vulnerability Management dashboards are a series of dashboards, designed to support organizations in implementing and monitoring the Essential Eight Strategies for mitigating cybersecurity risks. These comprehensive dashboards provide actionable insights into asset discovery, patch management, compliance, and exploitability to ensure a robust security posture across operating systems and applications.
The Australian Cyber Security Centre (ACSC) under the Australian Signals Directorate (ASD) provides guidance to address targeted cybersecurity intrusions through its Strategies to Mitigate Cyber Security Incidents. Among these, the Essential Eight describes the minimum set of preventative cybersecurity measures organizations should implement. This guidance, complemented by the Information Security Manual (ISM) controls, forms a robust framework to ensure the confidentiality, integrity, and availability of information technology and operational technology systems. This dashboard aligns with these controls to provide critical insights into the implementation of the Essential Eight.
The Tenable One Platform combines a suite of sensors to facilitate efficient vulnerability scanning, regardless of network complexity. By leveraging Tenable's capabilities, organizations can effectively discover, assess, and understand their attack surface, gaining comprehensive insights into exposure points. This is coupled with Exposure Response features that prioritize remediation efforts based on contextual risk. The dashboard includes critical features to highlight asset discovery, identify unsupported systems, monitor patch management timelines, track compliance rates, and classify exploitable vulnerabilities, ensuring comprehensive coverage of the Essential Eight.
The dashboards combine Tenable’s comprehensive vulnerability scanning, exposure insights, and asset prioritization with the ASD’s Essential Eight Strategies. By using the dashboard in conjunction with ISM controls and asset tagging, organizations can enhance their cybersecurity maturity, address vulnerabilities more effectively, and ensure compliance with Australia’s cybersecurity standards.
ASD Essential 8: Other Assets
The ASD Essential 8: Other Assets dashboard is designed to support organisations in implementing and monitoring the Essential Eight Strategies for mitigating cybersecurity risks. This comprehensive dashboard provides actionable insights into asset discovery, patch management, compliance, and exploitability to ensure a robust security posture across applications.
The ISM designates two categories for patch operating systems, they are: internet-facing and non-internet-facing. Per the ISM, an internet-facing asset (server, network equipment, etc) is any asset that is directly accessible over the internet, therefore non-internet-facing assets are all other assets including workstations. Each of the categories is separated into three patch classifications, they are: operating system, device drivers, and firmware. To identify the three classifications, Tenable security engineering working with partners identified three properties that reliably identified the finding in question, they are: plugin name, common platform enumeration (CPE) string, and the solution property. The ISM's covered by this dashboard are: ISM-1501, ISM-1695, ISM-1696, ISM-1697, ISM-1702, ISM-1879, ISM-1902, ISM-1903, and ISM-1904.
The ASD's Blueprint for Secure Cloud Patch Operating Systems () provides recommendations with respect to how the assets should be scanned and evaluated. The blueprint discusses scanning strategies, maturity levels, and other aspects of a healthy exposure management program. While the recommendations provided by the blueprint do not provide specific guidance, the samples help illustrate a healthily Exposure Management program. The dashboard brings together information that provides evidence of the material impact to the organisations risk exposure.
The focus of this dashboard is on:
-
Scan Frequency
-
Patching
-
Unsupported Applications
-
And Prioritisation
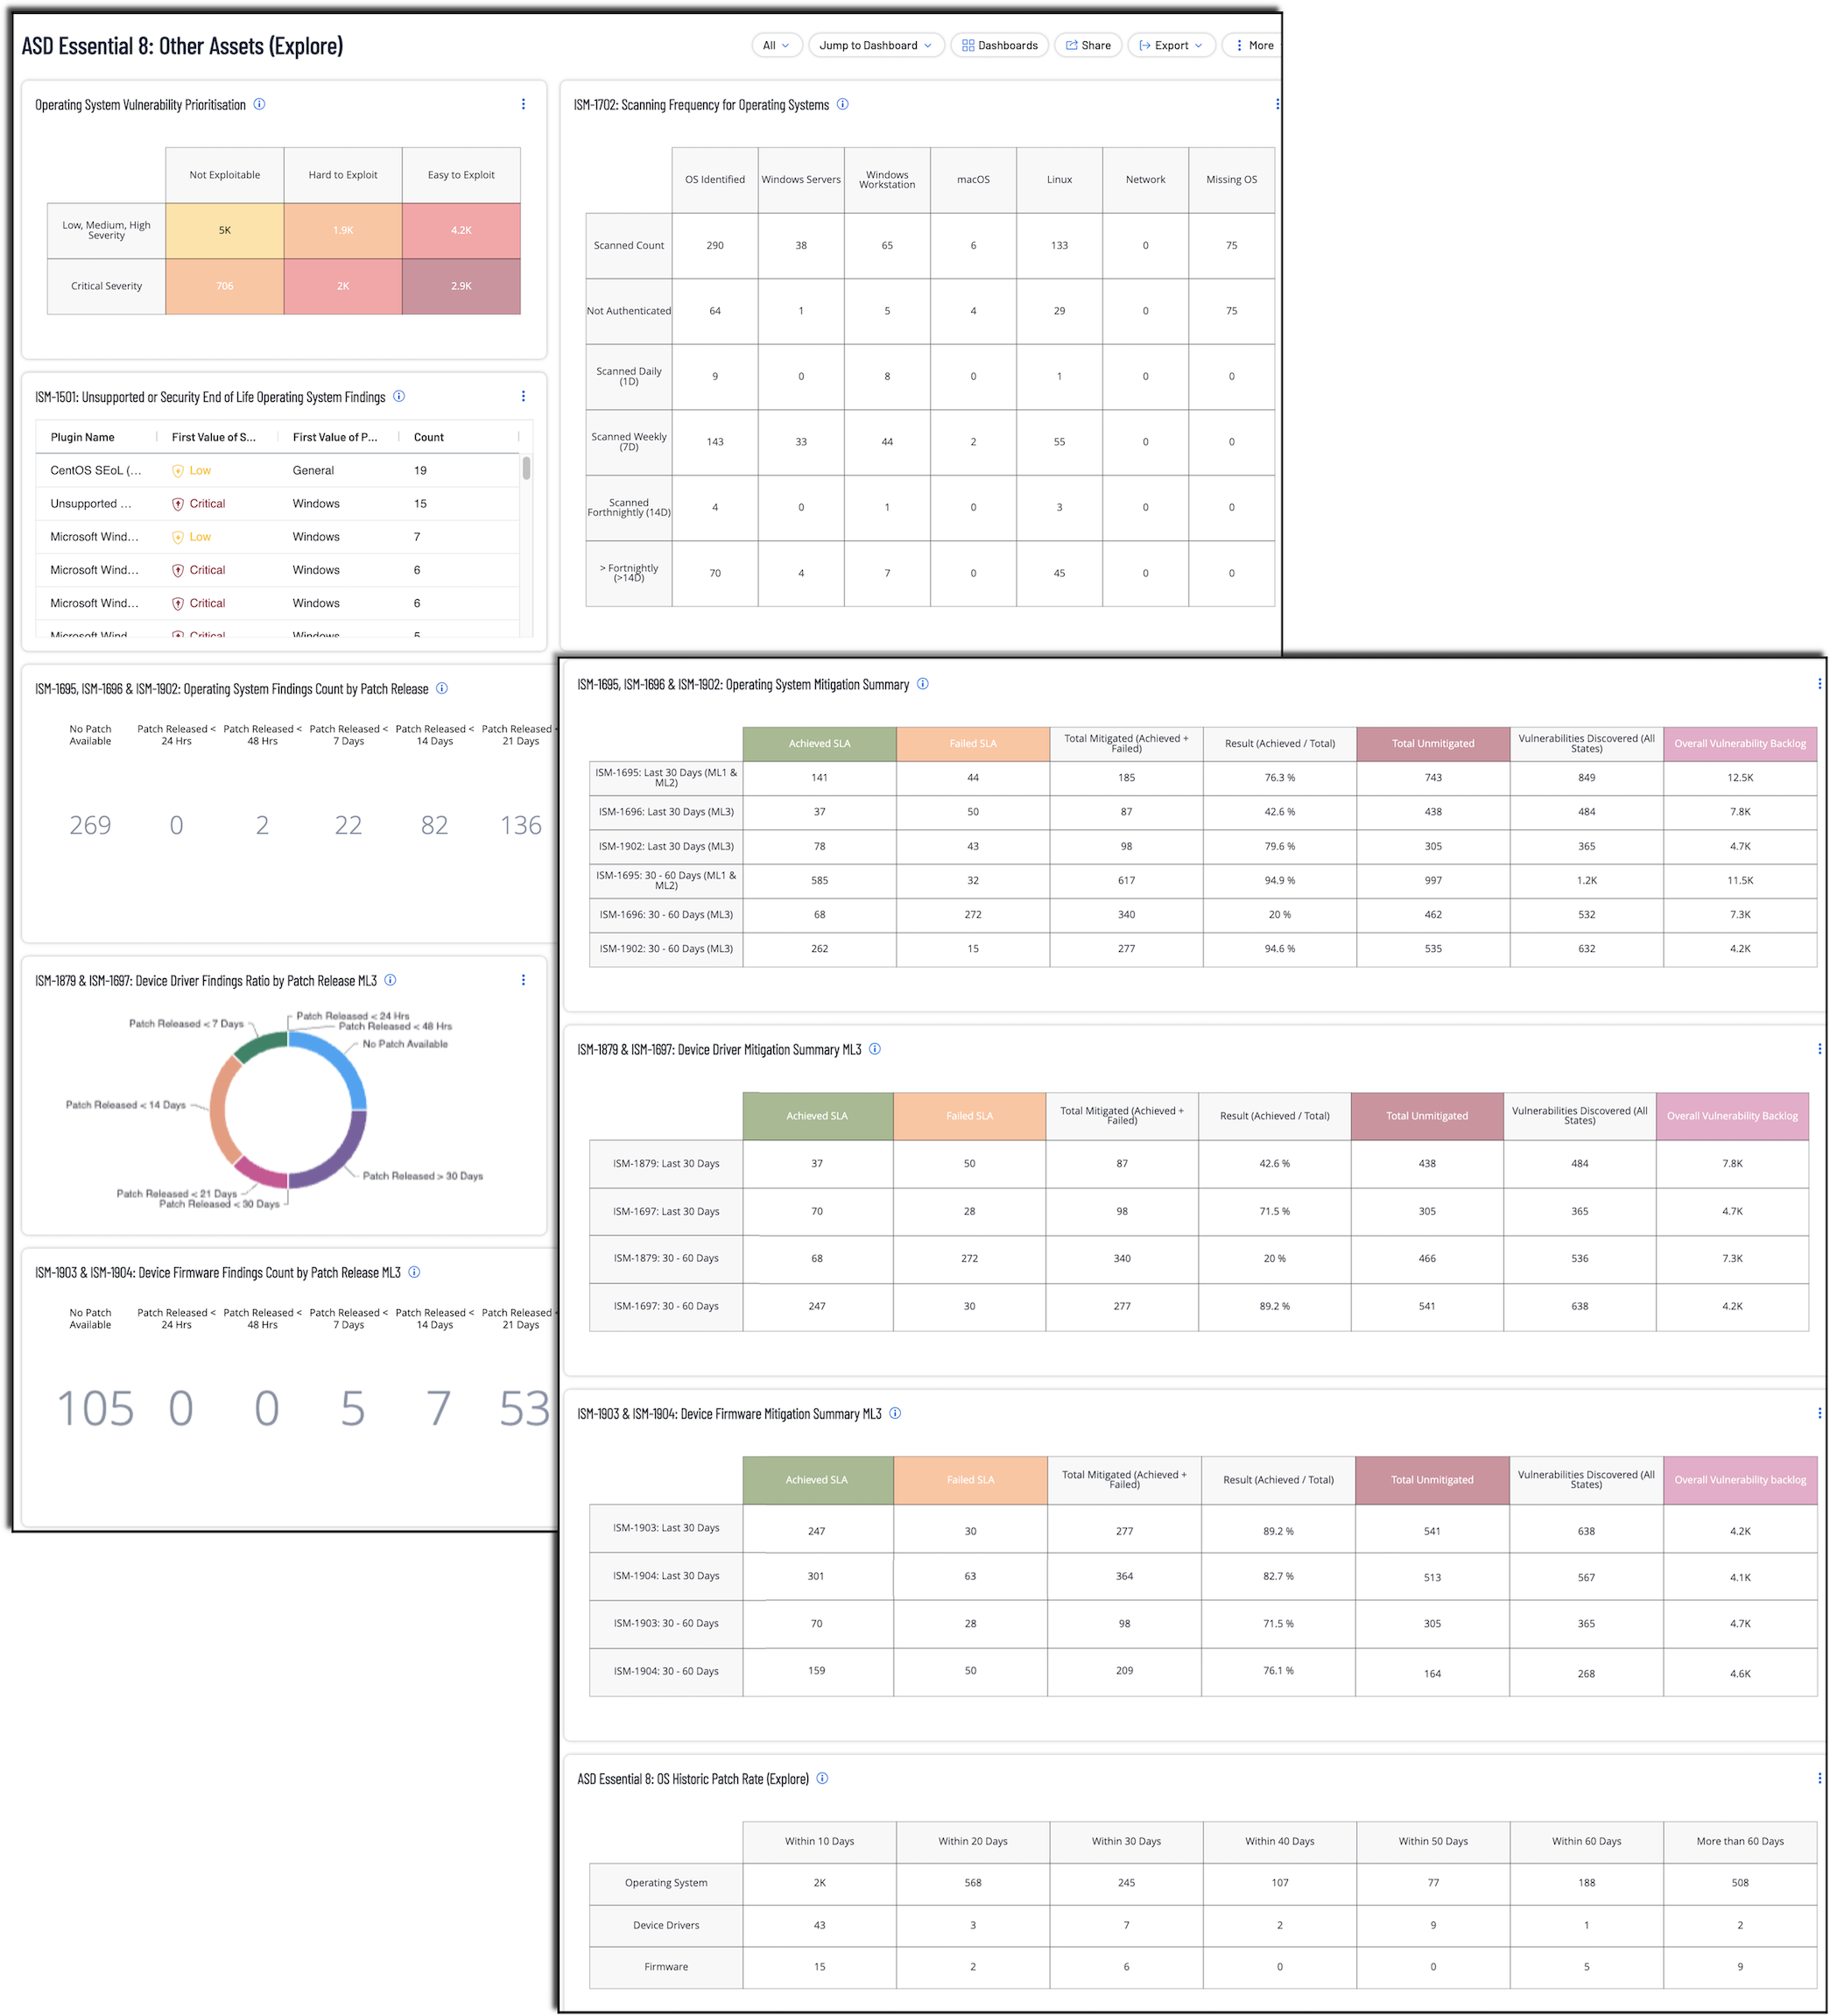
Note: To maximize relevance, organisations should leverage Asset Tagging when using this dashboard. This feature ensures that the dashboard can be filtered to focus on data critical to implementing the Essential Eight. Tagging assets differentiation for stricter service-level agreements (SLAs). For example, critical business systems may require stricter consideration, while other systems may have a longer patching window. Asset tags, composed of Category:Value pairs (e.g., E8: Other), can be applied manually or automatically using filtering rules such as public IP ranges, open ports (e.g., 80, 443), or cloud metadata. This categorisation simplifies monitoring and prioritisation for Essential Eight compliance, ensuring that organisations address vulnerabilities in their most critical assets. Tagging by application risk level (e.g., High Risk, Low Risk) or system role further enhances visibility. For more details, refer to Tenable's Tagging Documentation. See ‘Tagging and Dynamic Asset Lists Section’ for more information.
ASD Essential 8: Internet Facing Assets
The ASD Essential 8: Internet Facing Assets dashboard is designed to support organisations in implementing and monitoring the Essential Eight Strategies for mitigating cybersecurity risks. This comprehensive dashboard provides actionable insights into asset discovery, patch management, compliance, and exploitability to ensure a robust security posture across applications.
The Australian Cyber Security Centre (ACSC) under the Australian Signals Directorate (ASD) provides guidance to address targeted cybersecurity intrusions through its Strategies to Mitigate Cyber Security Incidents. Among these, the Essential Eight describes the minimum set of preventative cybersecurity measures organisations should implement. This guidance, complemented by the Information Security Manual (ISM) controls, forms a robust framework to ensure the confidentiality, integrity, and availability of information technology and operational technology systems. This dashboard aligns with these controls to provide critical insights into the implementation of the Essential Eight.
The ISM designates two categories for patch operating systems, they are: internet-facing and non-internet-facing. Per the ISM, an internet-facing asset (server, network equipment, etc) is any asset that is directly accessible over the internet. Each of the categories is separated into three patch classifications, they are: operating system, device drivers, and firmware. To identify the three classifications, Tenable security engineering working with partners identified three properties that reliably identified the finding in question, they are: plugin name, common platform enumeration (CPE) string, and the solution property. The ISM's covered by this dashboard are:ISM-1501, ISM-1694, ISM-1697, ISM-1701, ISM-1877, ISM-1879, ISM-1903, and ISM-1904.
The ASD's Blueprint for Secure Cloud Patch Operating Systems (https://blueprint.asd.gov.au/security-and-governance/essential-eight/patch-os/) provides recommendations with respect to how the assets should be scanned and evaluated. The blueprint discusses scanning strategies, maturity levels, and other aspects of a healthy exposure management program. While the recommendations provided by the blueprint do not provide specific guidance, the samples help illustrate a healthily Exposure Management program. The dashboard brings together information that provides evidence of the material impact to the organisations risk exposure.
The focus of this dashboard is on:
-
Scan Frequency
-
Patching
-
Unsupported Applications
-
And Prioritisation
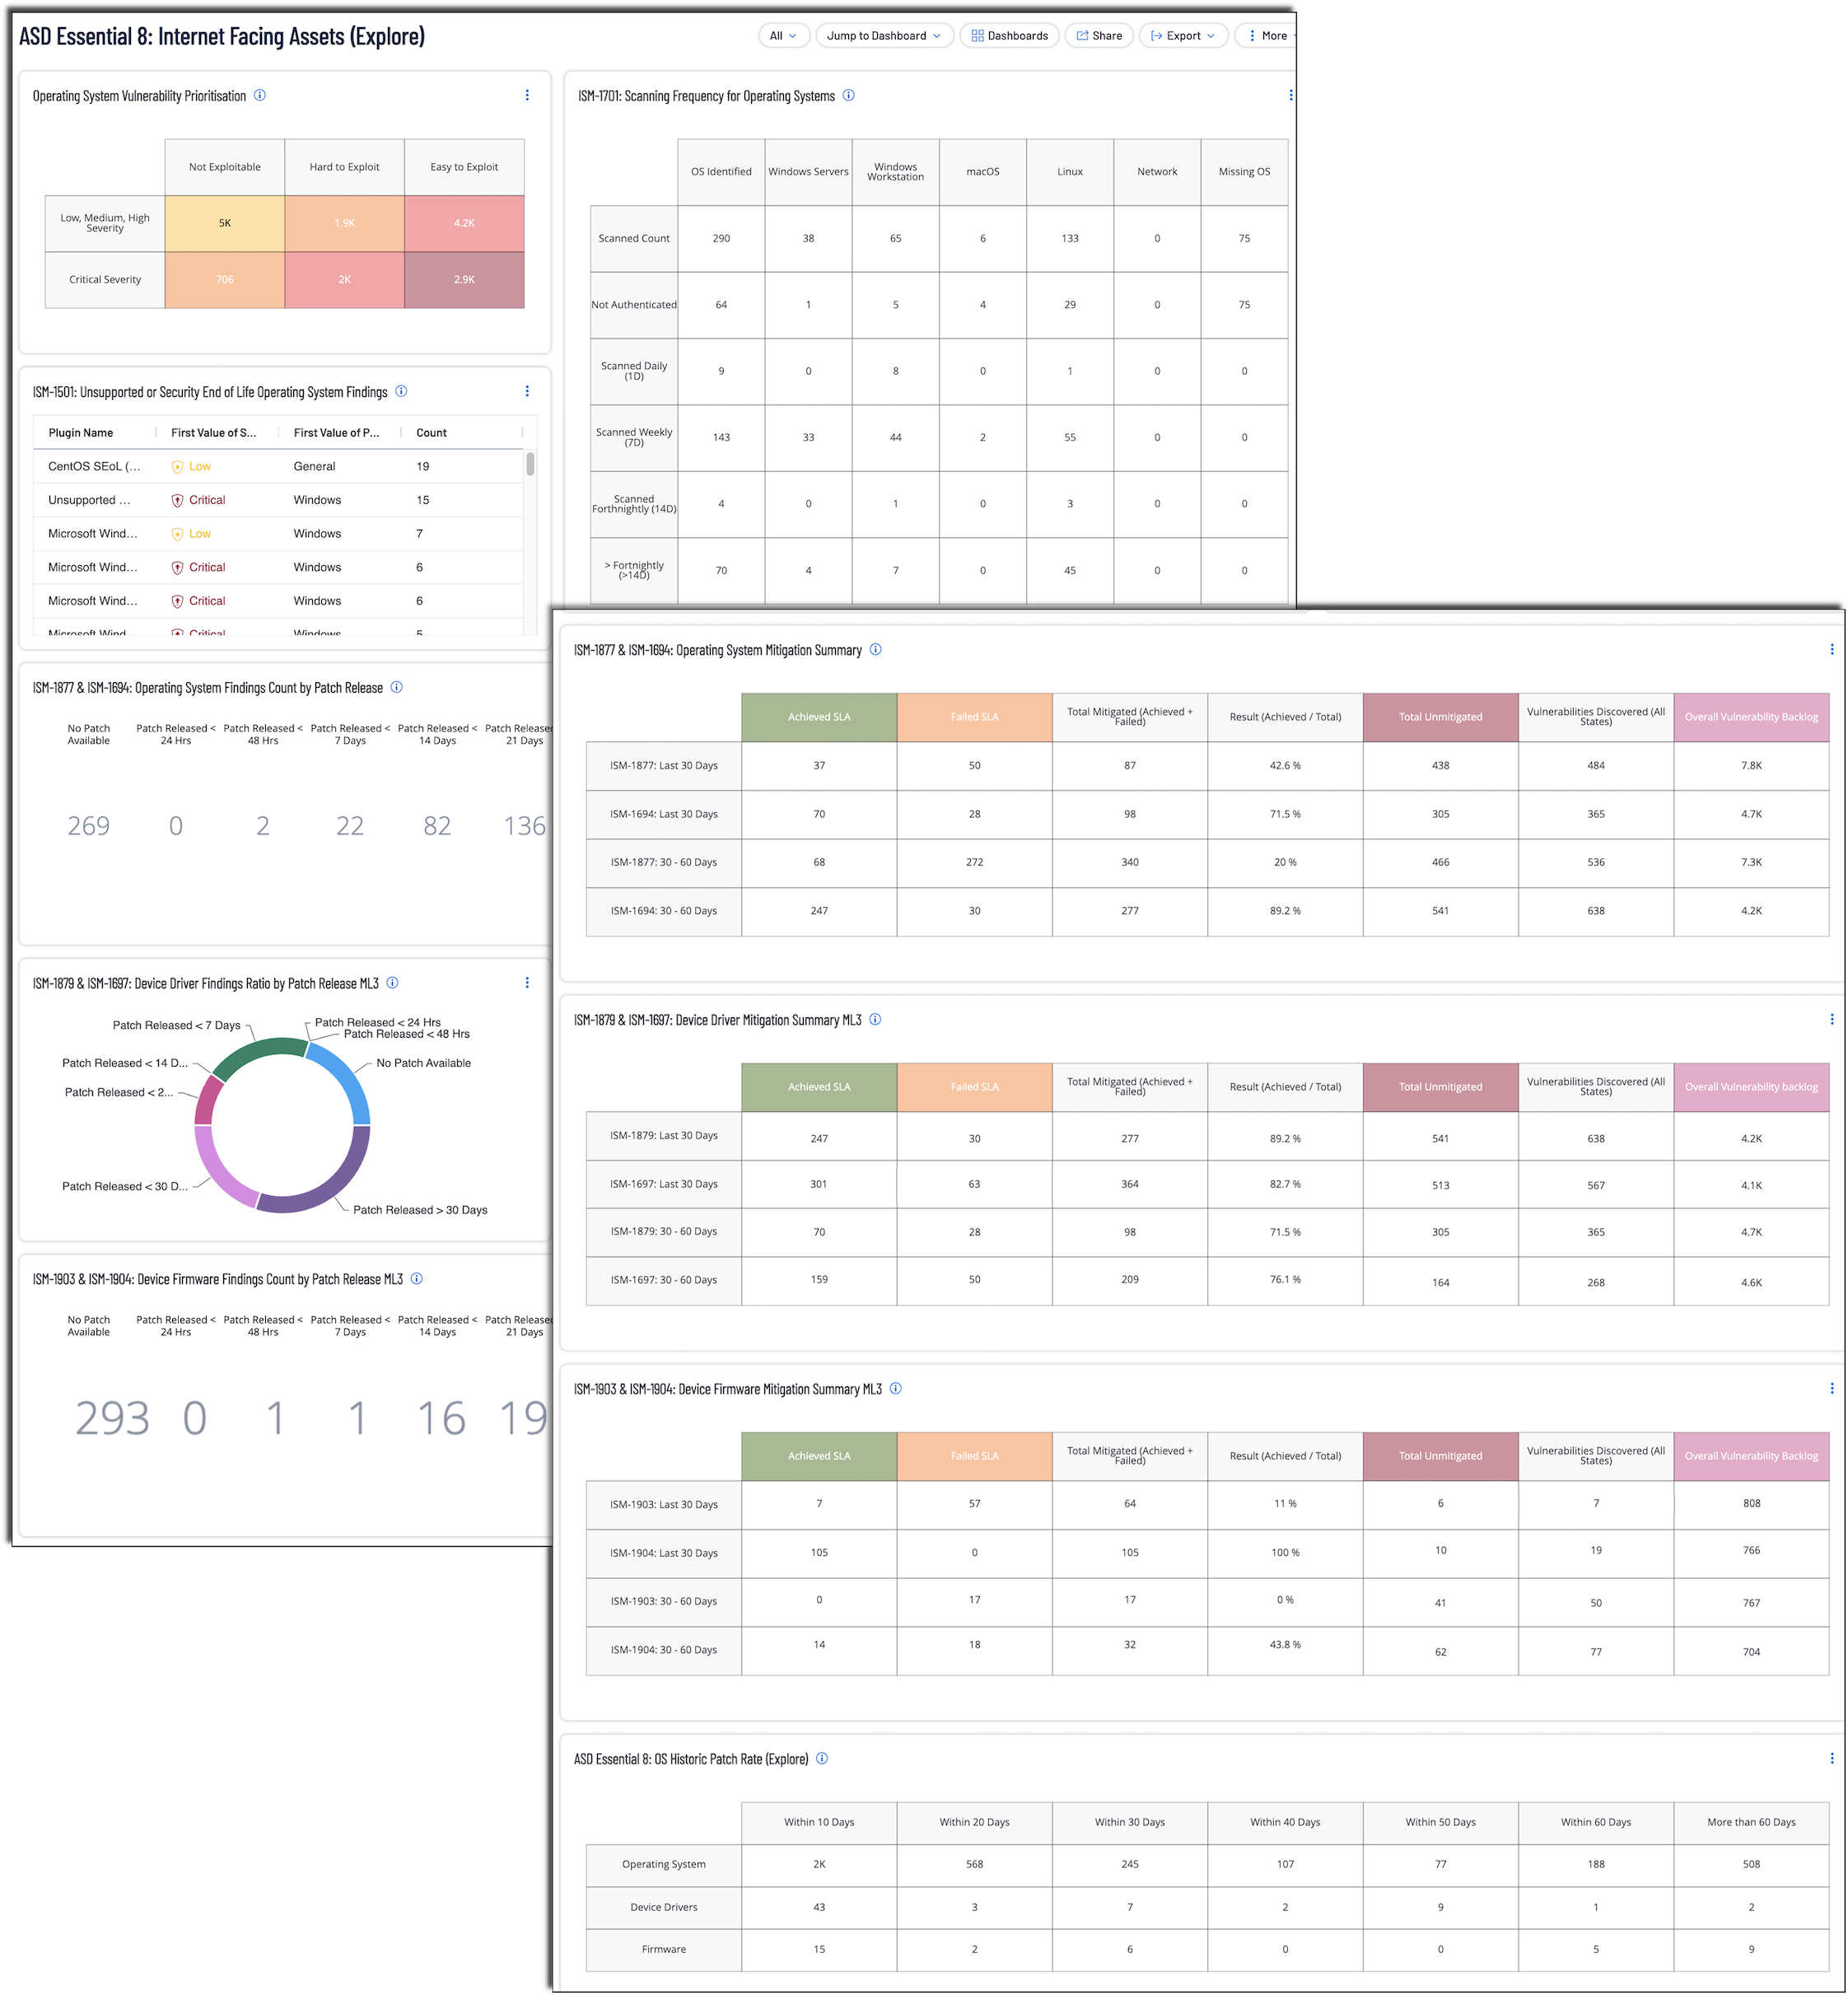
Note: To maximize relevance, organisations should leverage Asset Tagging. This feature ensures that the dashboard can be filtered to focus on data critical to implementing the Essential Eight. Tagging assets differentiation for stricter service-level agreements (SLAs). For example, critical business systems may require stricter consideration, while other systems may have a longer patching window. Asset tags, composed of Category:Value pairs (e.g., E8:Internet Facing), can be applied manually or automatically using filtering rules such as public IP ranges, open ports (e.g., 80, 443), or cloud metadata. This categorisation simplifies monitoring and prioritisation for Essential Eight compliance, ensuring that organisations address vulnerabilities in their most critical assets. Tagging by application risk level (e.g., High Risk, Low Risk) or system role further enhances visibility. For more details, refer to Tenable's Tagging Documentation. See ‘Tagging and Dynamic Asset Lists Section’ for more information.
ASD Essential 8: Patch Applications
The ASD Essential 8: Patch Applications dashboard is designed to support organisations in implementing and monitoring the Essential Eight Strategies for mitigating cybersecurity risks. This comprehensive dashboard provides actionable insights into asset discovery, patch management, compliance, and exploitability to ensure a robust security posture across applications.
The Australian Cyber Security Centre (ACSC) under the Australian Signals Directorate (ASD) provides guidance to address targeted cybersecurity intrusions through its Strategies to Mitigate Cyber Security Incidents. Among these, the Essential Eight describes the minimum set of preventative cybersecurity measures organisations should implement. This guidance, complemented by the Information Security Manual (ISM) controls, forms a robust framework to ensure the confidentiality, integrity, and availability of information technology and operational technology systems. This dashboard aligns with these controls to provide critical insights into the implementation of the Essential Eight.
The ISM designates three categories for application, they are: Online Services, Core, and Others. Per the ISM, online service is any service that is directly accessible over the internet, and Core Applications are defined as commonly targeted applications which include office productivity suites, web browsers and their extensions, email clients, PDF software and security products. The Other category is all other software not previously defined within Core Applications. Tenable security engineering working with partners identified CPE strings common for Online Services and Core Application. The ISM's covered by this dashboard are: ISM-0304, ISM-1690, ISM-1691, ISM-1692, ISM-1693, ISM-1698, ISM-1699, ISM-1700, ISM-1704, ISM-1807, ISM-1876, ISM-1901, and ISM-1905.
The ASD's Blueprint for Secure Cloud Patch Applications provides recommendations with respect to how the applications should be scanned and evaluated. The blueprint discusses scanning strategies, maturity levels, and other aspects of a healthy exposure management program. While the recommendations provided by the blueprint do not provide specific guidance, the samples help illustrate a healthy Exposure Management program. The dashboard brings together information that provides evidence of the material impact to the organisations risk exposure.
The focus of this dashboard is on:
-
Asset Discovery
-
Scan Frequency
-
Patching
-
Unsupported Applications
-
And Prioritisation
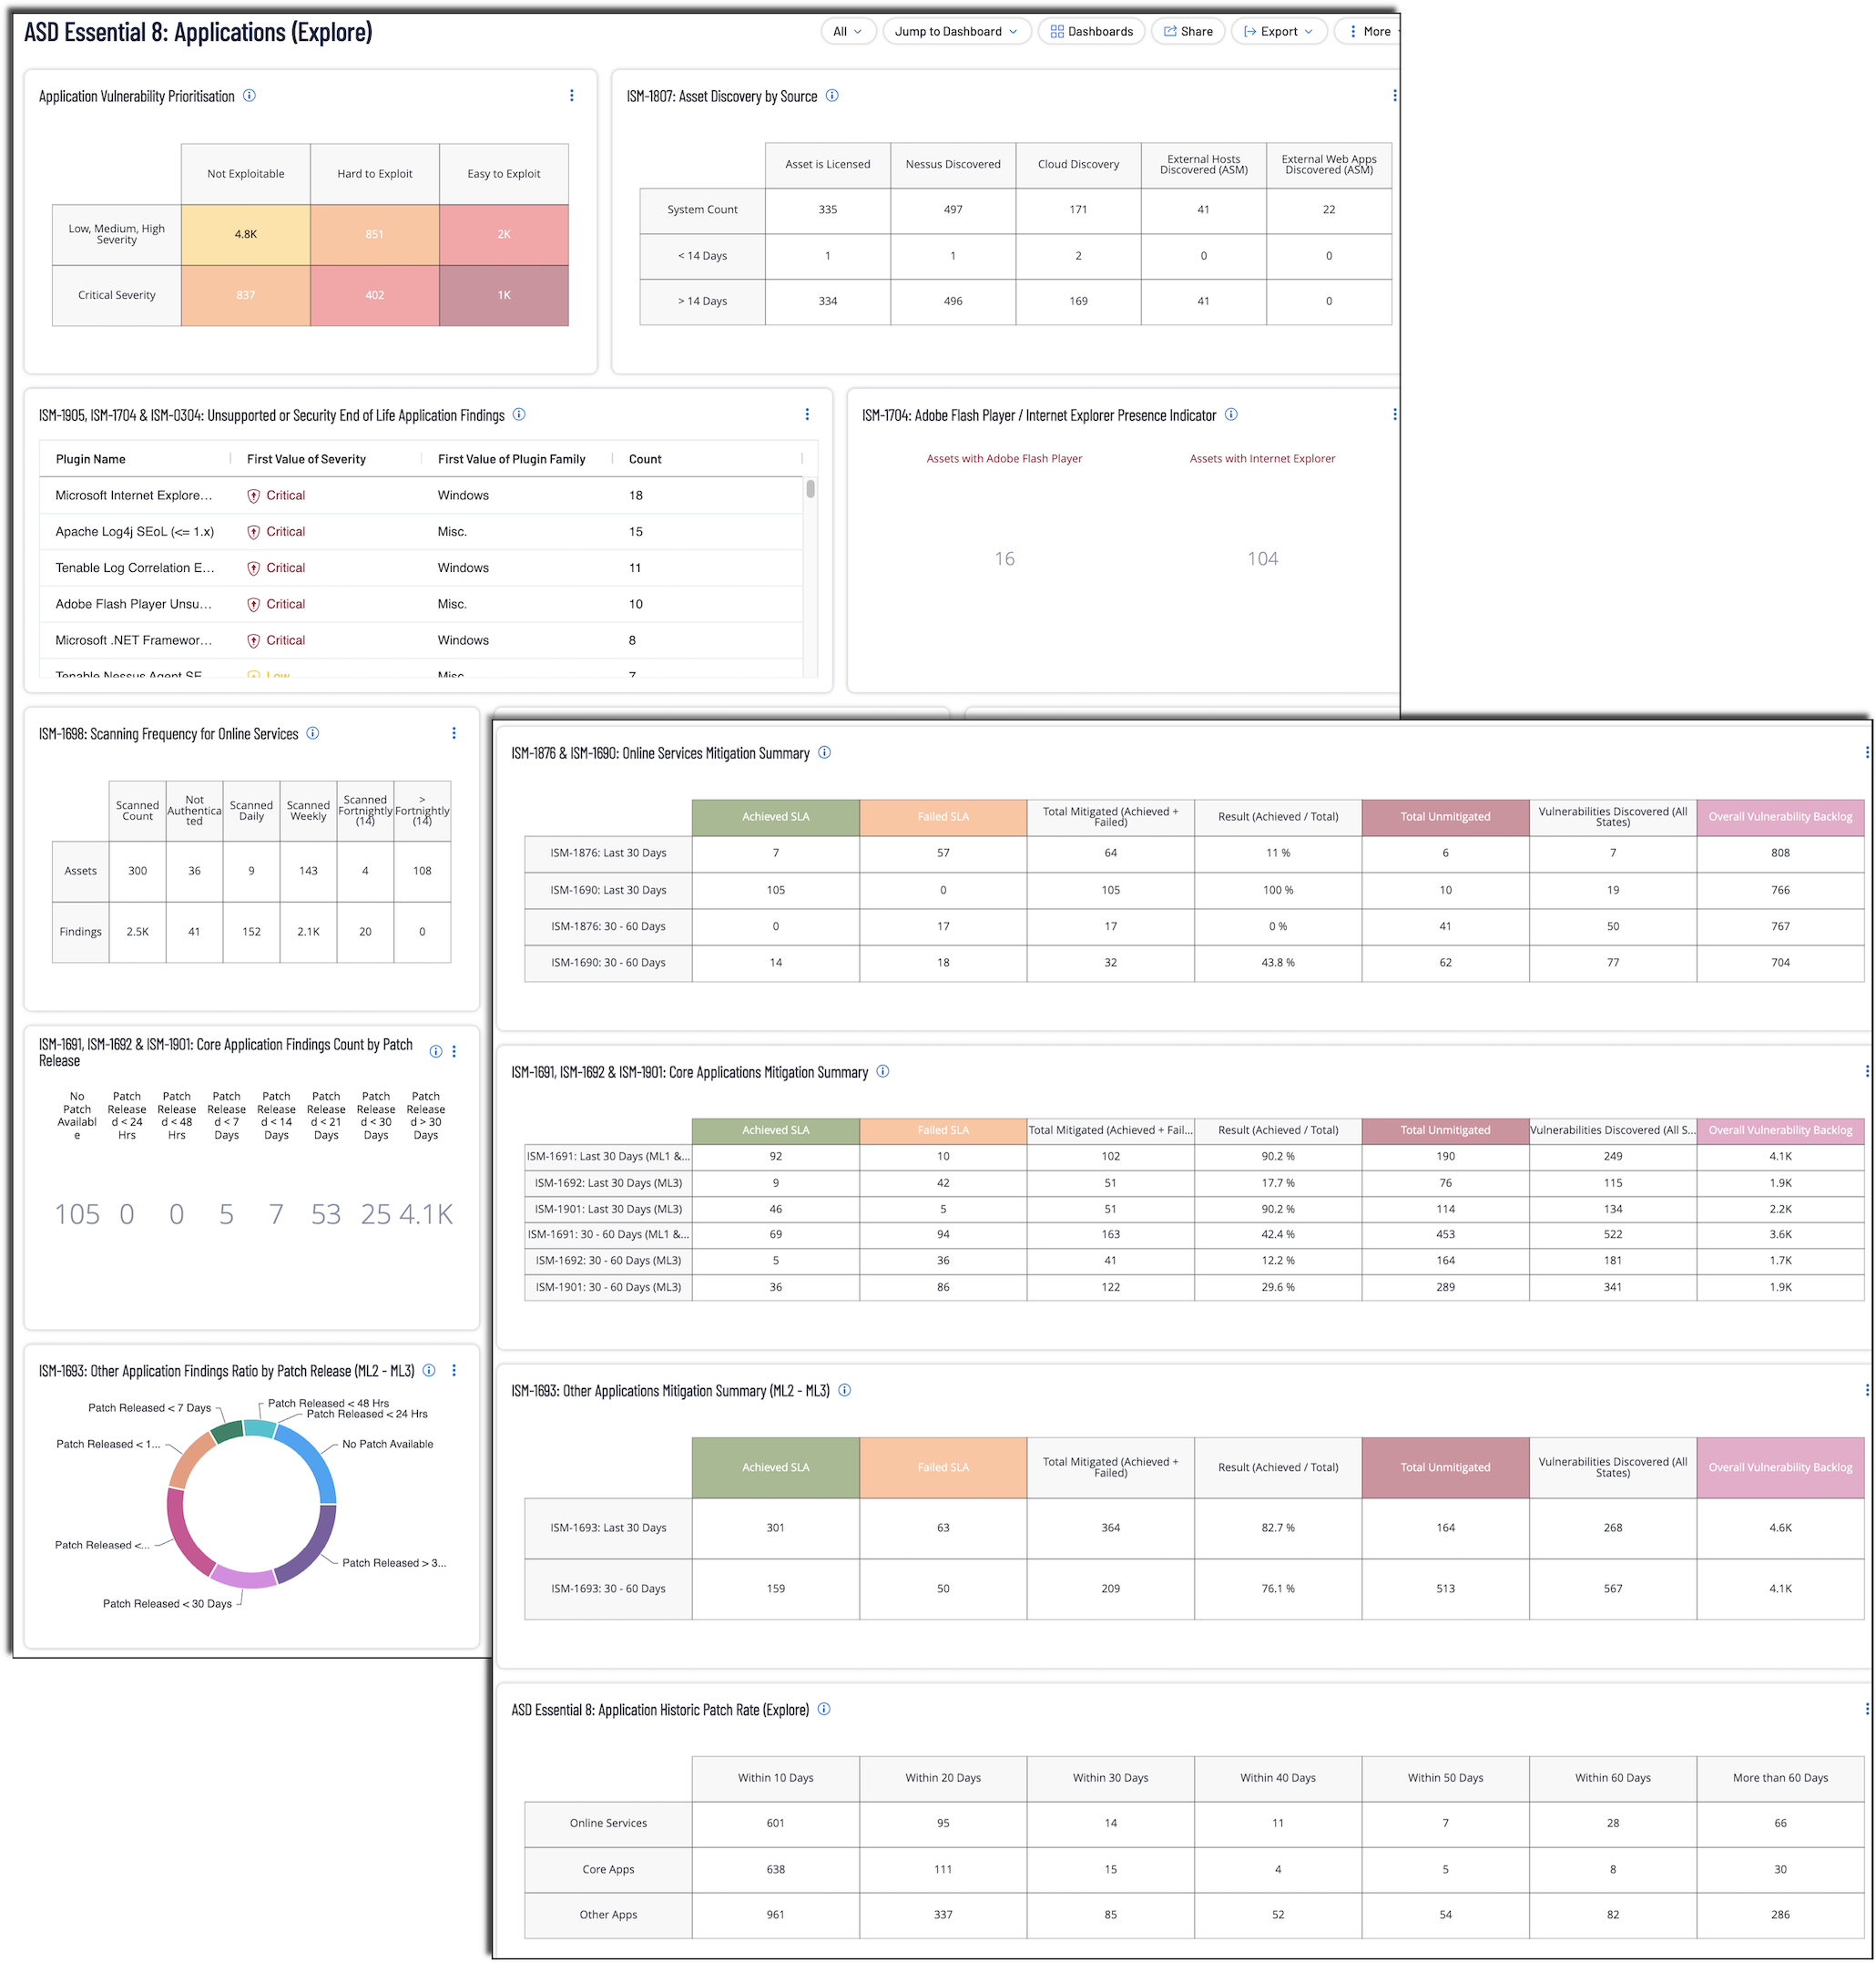
Note: To maximize relevance, organisations should leverage Asset Tagging. This feature ensures that the dashboard can be filtered to focus on data critical to implementing the Essential Eight. Tagging assets differentiation for stricter service-level agreements (SLAs). For example, critical business systems may require stricter consideration, while other systems may have a longer patching window. Asset tags, composed of Category:Value pairs (e.g., E8: Applications), can be applied manually or automatically using filtering rules such as public IP ranges, open ports (e.g., 80, 443), or cloud metadata. This categorisation simplifies monitoring and prioritisation for Essential Eight compliance, ensuring that organisations address vulnerabilities in their most critical assets. Tagging by application risk level (e.g., High Risk, Low Risk) or system role further enhances visibility. For more details, refer to Tenable's Tagging Documentation. See ‘Tagging and Dynamic Asset Lists Section’ for more information.