Widget/Component Creation
Creating widgets in Tenable Vulnerability Management or components in Tenable Security Center can help a security team visualize the data coming from the compliance scans run. After learning about ways to query the compliance data, creating widgets/components can be beneficial to easily track multiple queries. The widgets/components created can also be used within reports in both Tenable Vulnerability Management and Tenable Security Center. In the subsequent examples, the following filters are used to stay consistent unless otherwise noted: Audit Check Name = *patches* and Compliance Framework = CSCv8 for Tenable Vulnerability Management and, Plugin Name contains patches and Cross Reference = CSCv8|7* for Tenable Security Center. The following Widget/Component types are shown:
-
Pie Chart and Doughnuts
-
Tables
-
Bar Charts
Pie Chart / Doughnut
Tenable Vulnerability Management
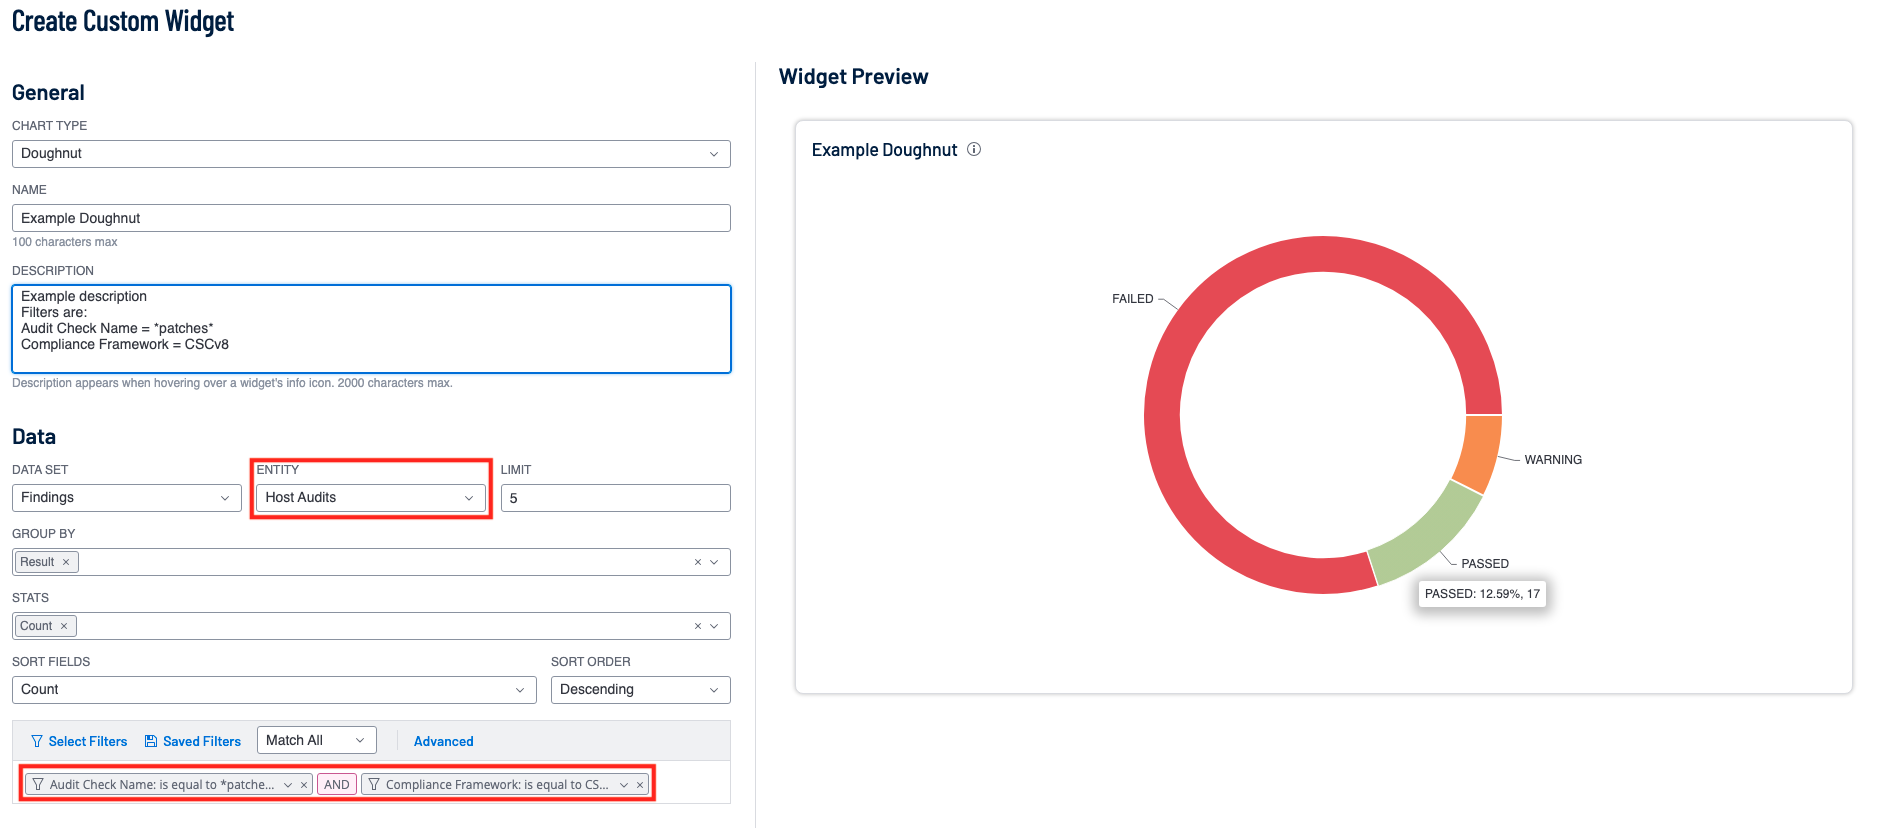
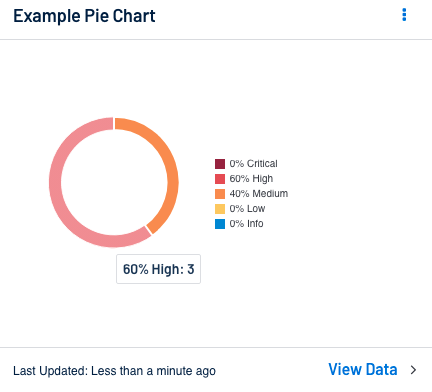
In Tenable Vulnerability Management the user can create a Doughnut chart by selecting the appropriate Chart Type. One thing to note is that different chart types are supported for different Entities. This means that when first starting to create a custom widget, setting the Entity resets the chart type, as the chosen one may not be available. In the Doughnut Chart example following the user can set the Entity to Host Audits, Chart Type to Doughnut, Group by to Result, Status to Count and Sort Fields to Count. These settings in combination with the Audit Check Name = *patches* and Compliance Framework = CSCv8 filters results in a visualization of the compliance results that include the word patches that are related to the CSCv8 Framework.
Tenable Security Center
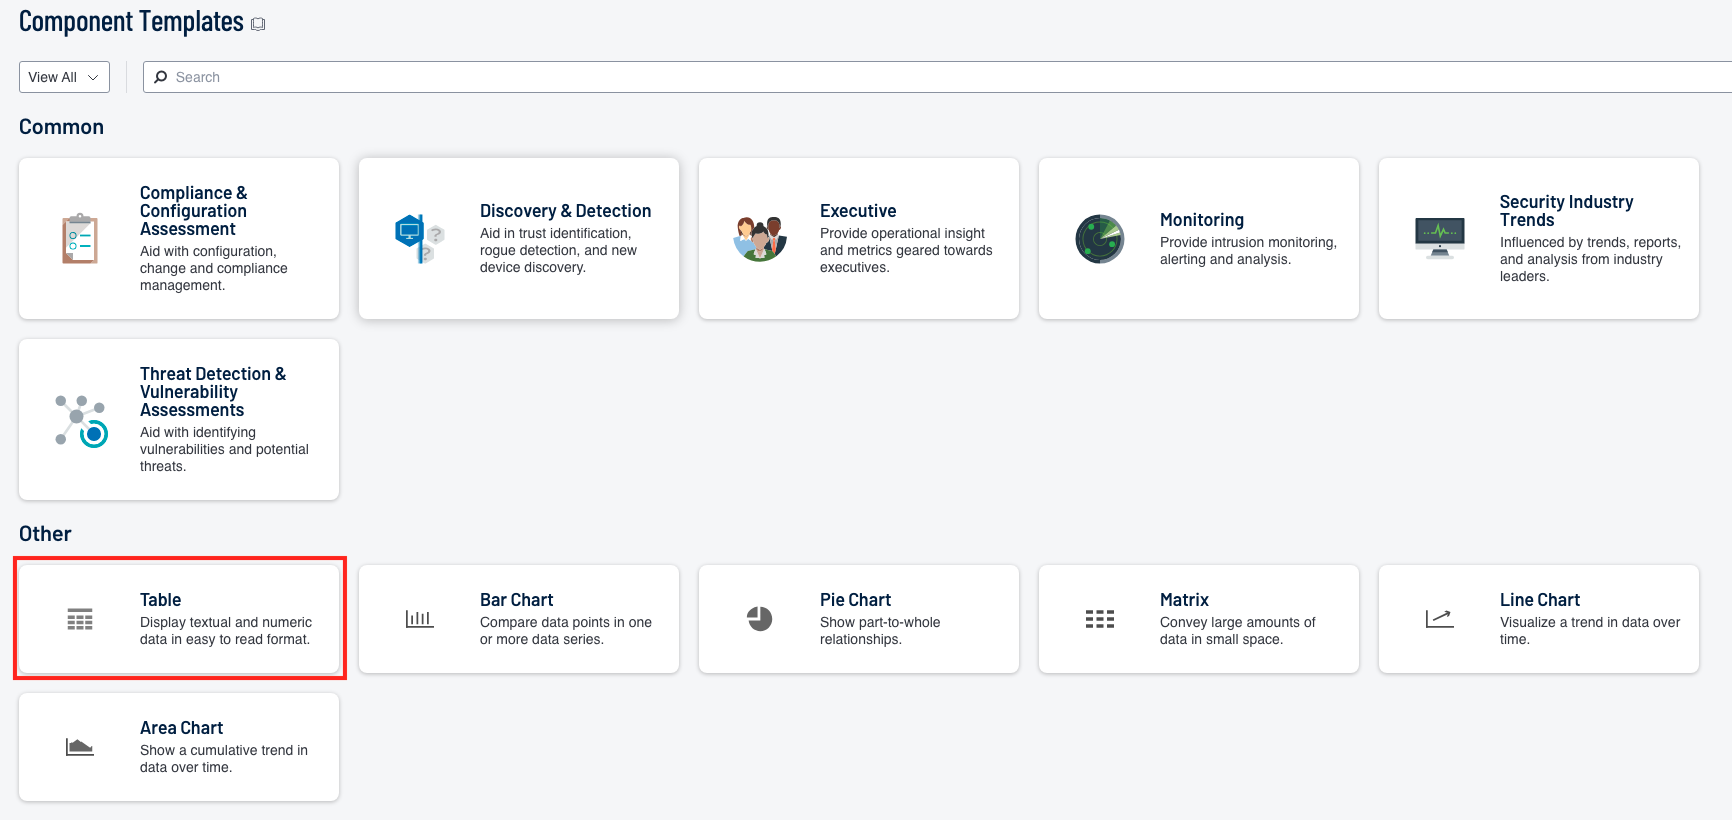
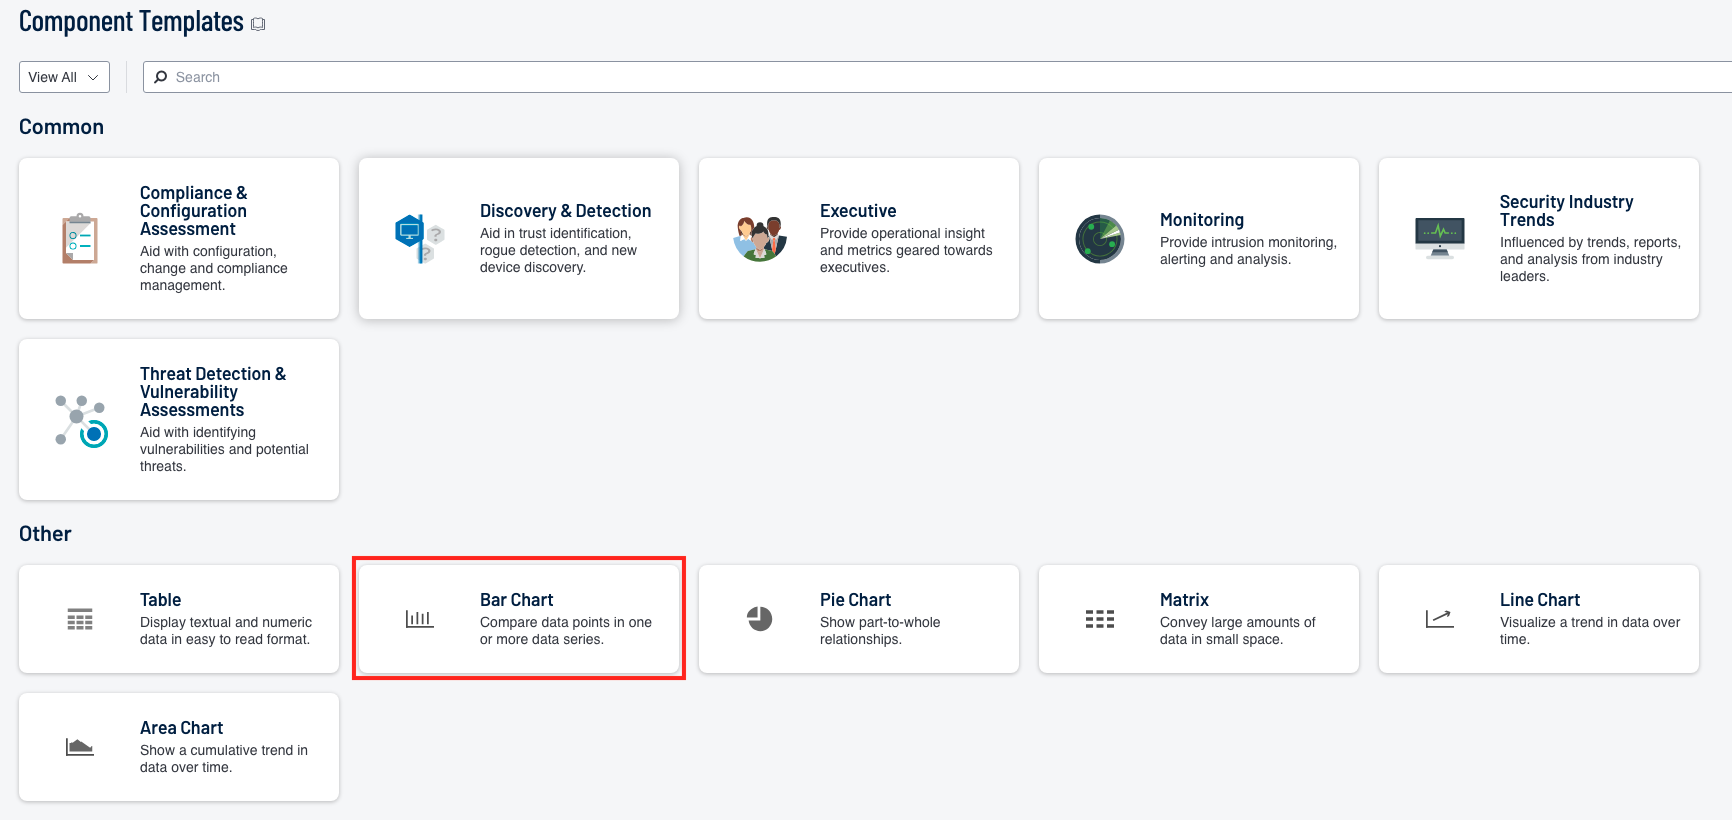
In Tenable Security Center the user can create a Pie Chart by selecting the appropriate selection within the “Other” section on the Component Templates page.
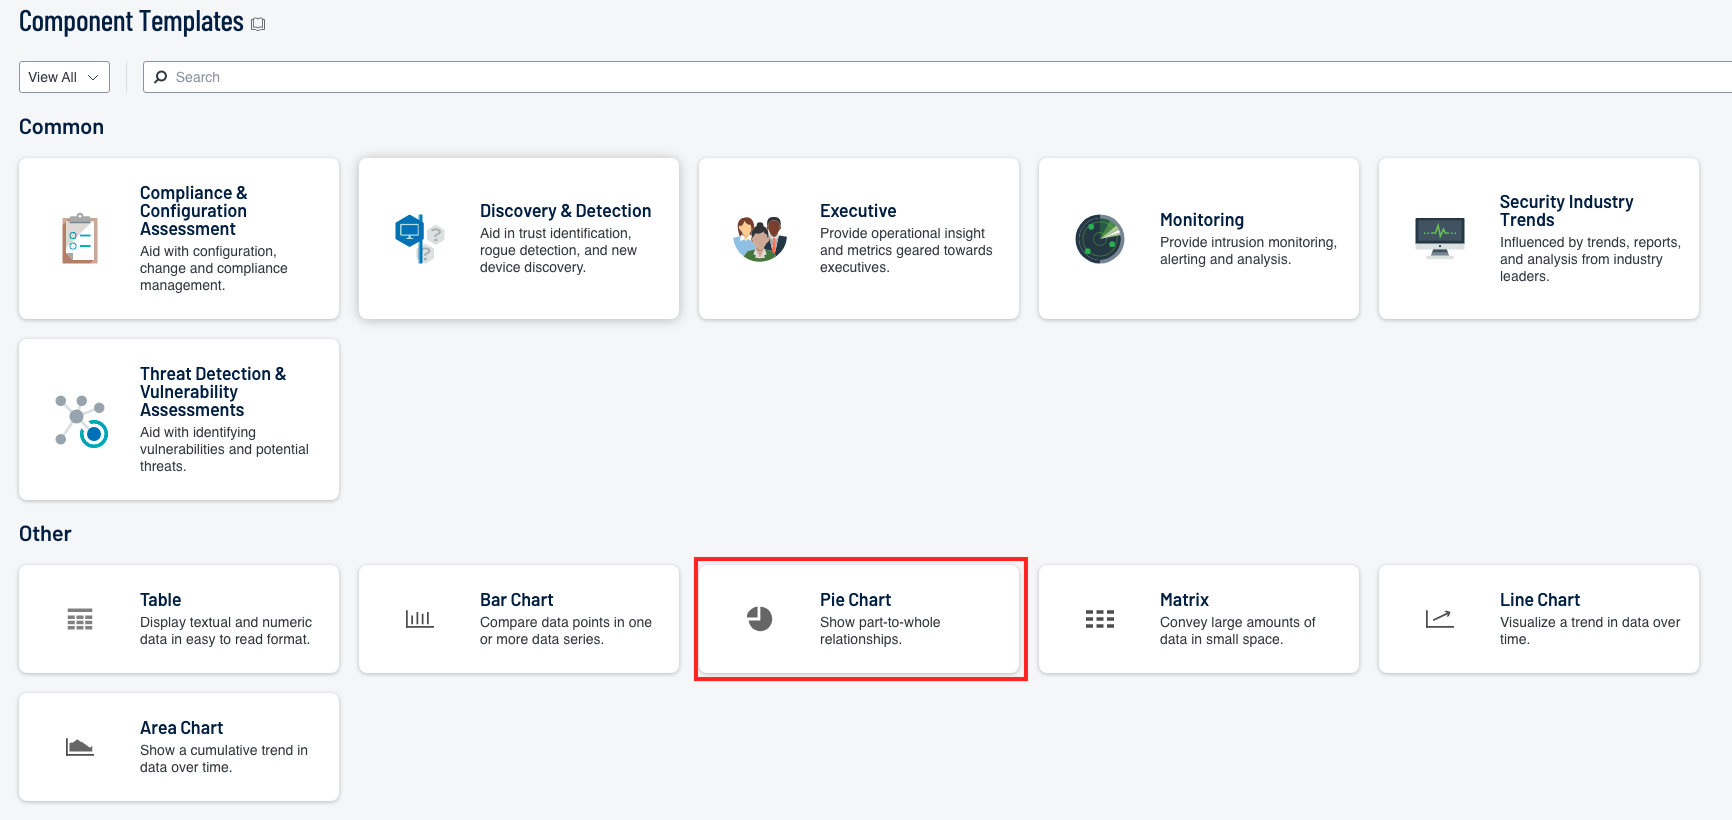
To match the example the user can use the “Severity Summary” tool to allow the pie chart to display the different Host Audit result types that match the query. Do note that with this tool the Low and Critical severities will always show 0% since compliance results can either be Info, Medium, or High Severity.
Table
Tenable Vulnerability Management
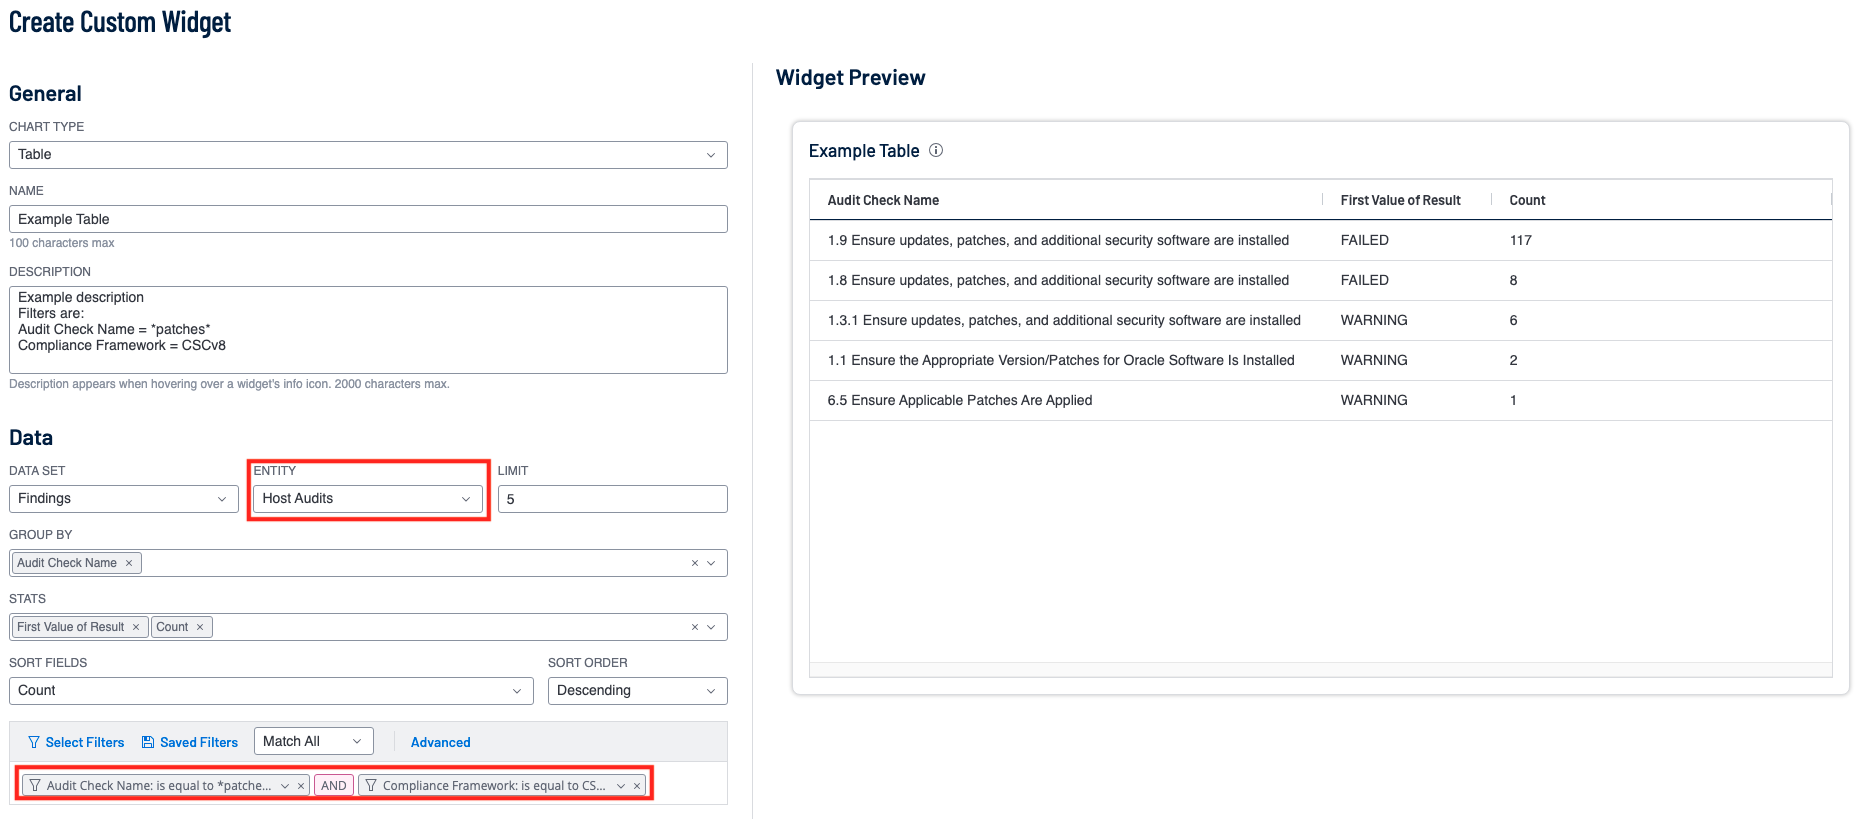
Tables in Tenable Vulnerability Management can be a quick way to visualize more detail in a condensed form. With many available columns available to use (the specific columns available are determined by the entity type), the user is able to quickly identify the most commonly failed checks in their organization. In the following example, using the same filters as the previous Tenable Vulnerability Management example, the widget displays the Audit Check which was run the most because the widget is sorted by count. The widget also displays the result of the first value of Results, this means the widget is only looking at the first value seen and prints it out. This can lead to a misinterpretation of the data as it may appear that there are 117 FAILED results when in reality it could be only one result failed and the rest passed. To rectify this, the user can add a Results filter to ensure only one result type is included in the Count column.
Tenable Security Center
Tables in Tenable Security Center can provide the same level of condensed detail that they can in Tenable Vulnerability management. Though in Tenable Security Center the determining factor on which columns can be used is the Tool used. The Table chart type can be selected via the Component Template page under the “Other” Section.
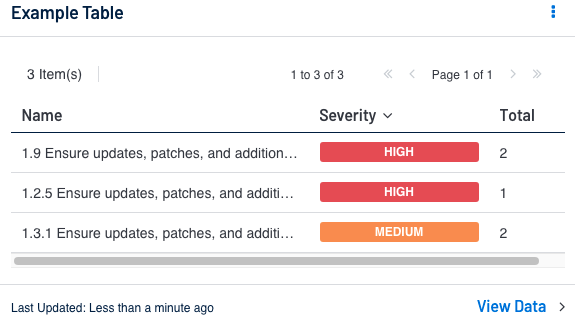
The following example shows the Vulnerability Summary tool to display the name of the audit checks run along with the severity and total number seen. This widget displays all result types seen, so the user can add the severity filter to see only a certain type of result. With this widget the total number represents the total number of specified plugin names and severity seen. This means that unlike in Tenable Vulnerability Management where the column is for the first value, Tenable Security Center separates the result types.
Bar / Column
Tenable Vulnerability Management
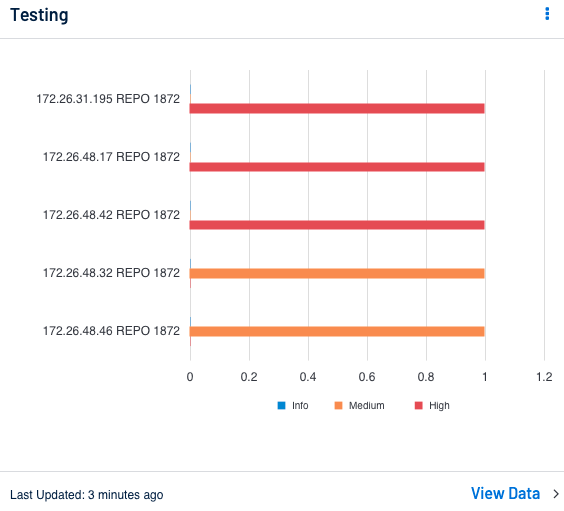
Tenable Vulnerability Management has two available bar-like chart types for Host Audit Entity: Bar and Column. These two chart types function the same way with the only difference being the orientation of the bar; bar charts are horizontal and columns are vertical. The following example groups the results by Asset Name and sorts by count. This configuration of the widget allows the user to see which asset has the most failed audit checks which match the filters used.
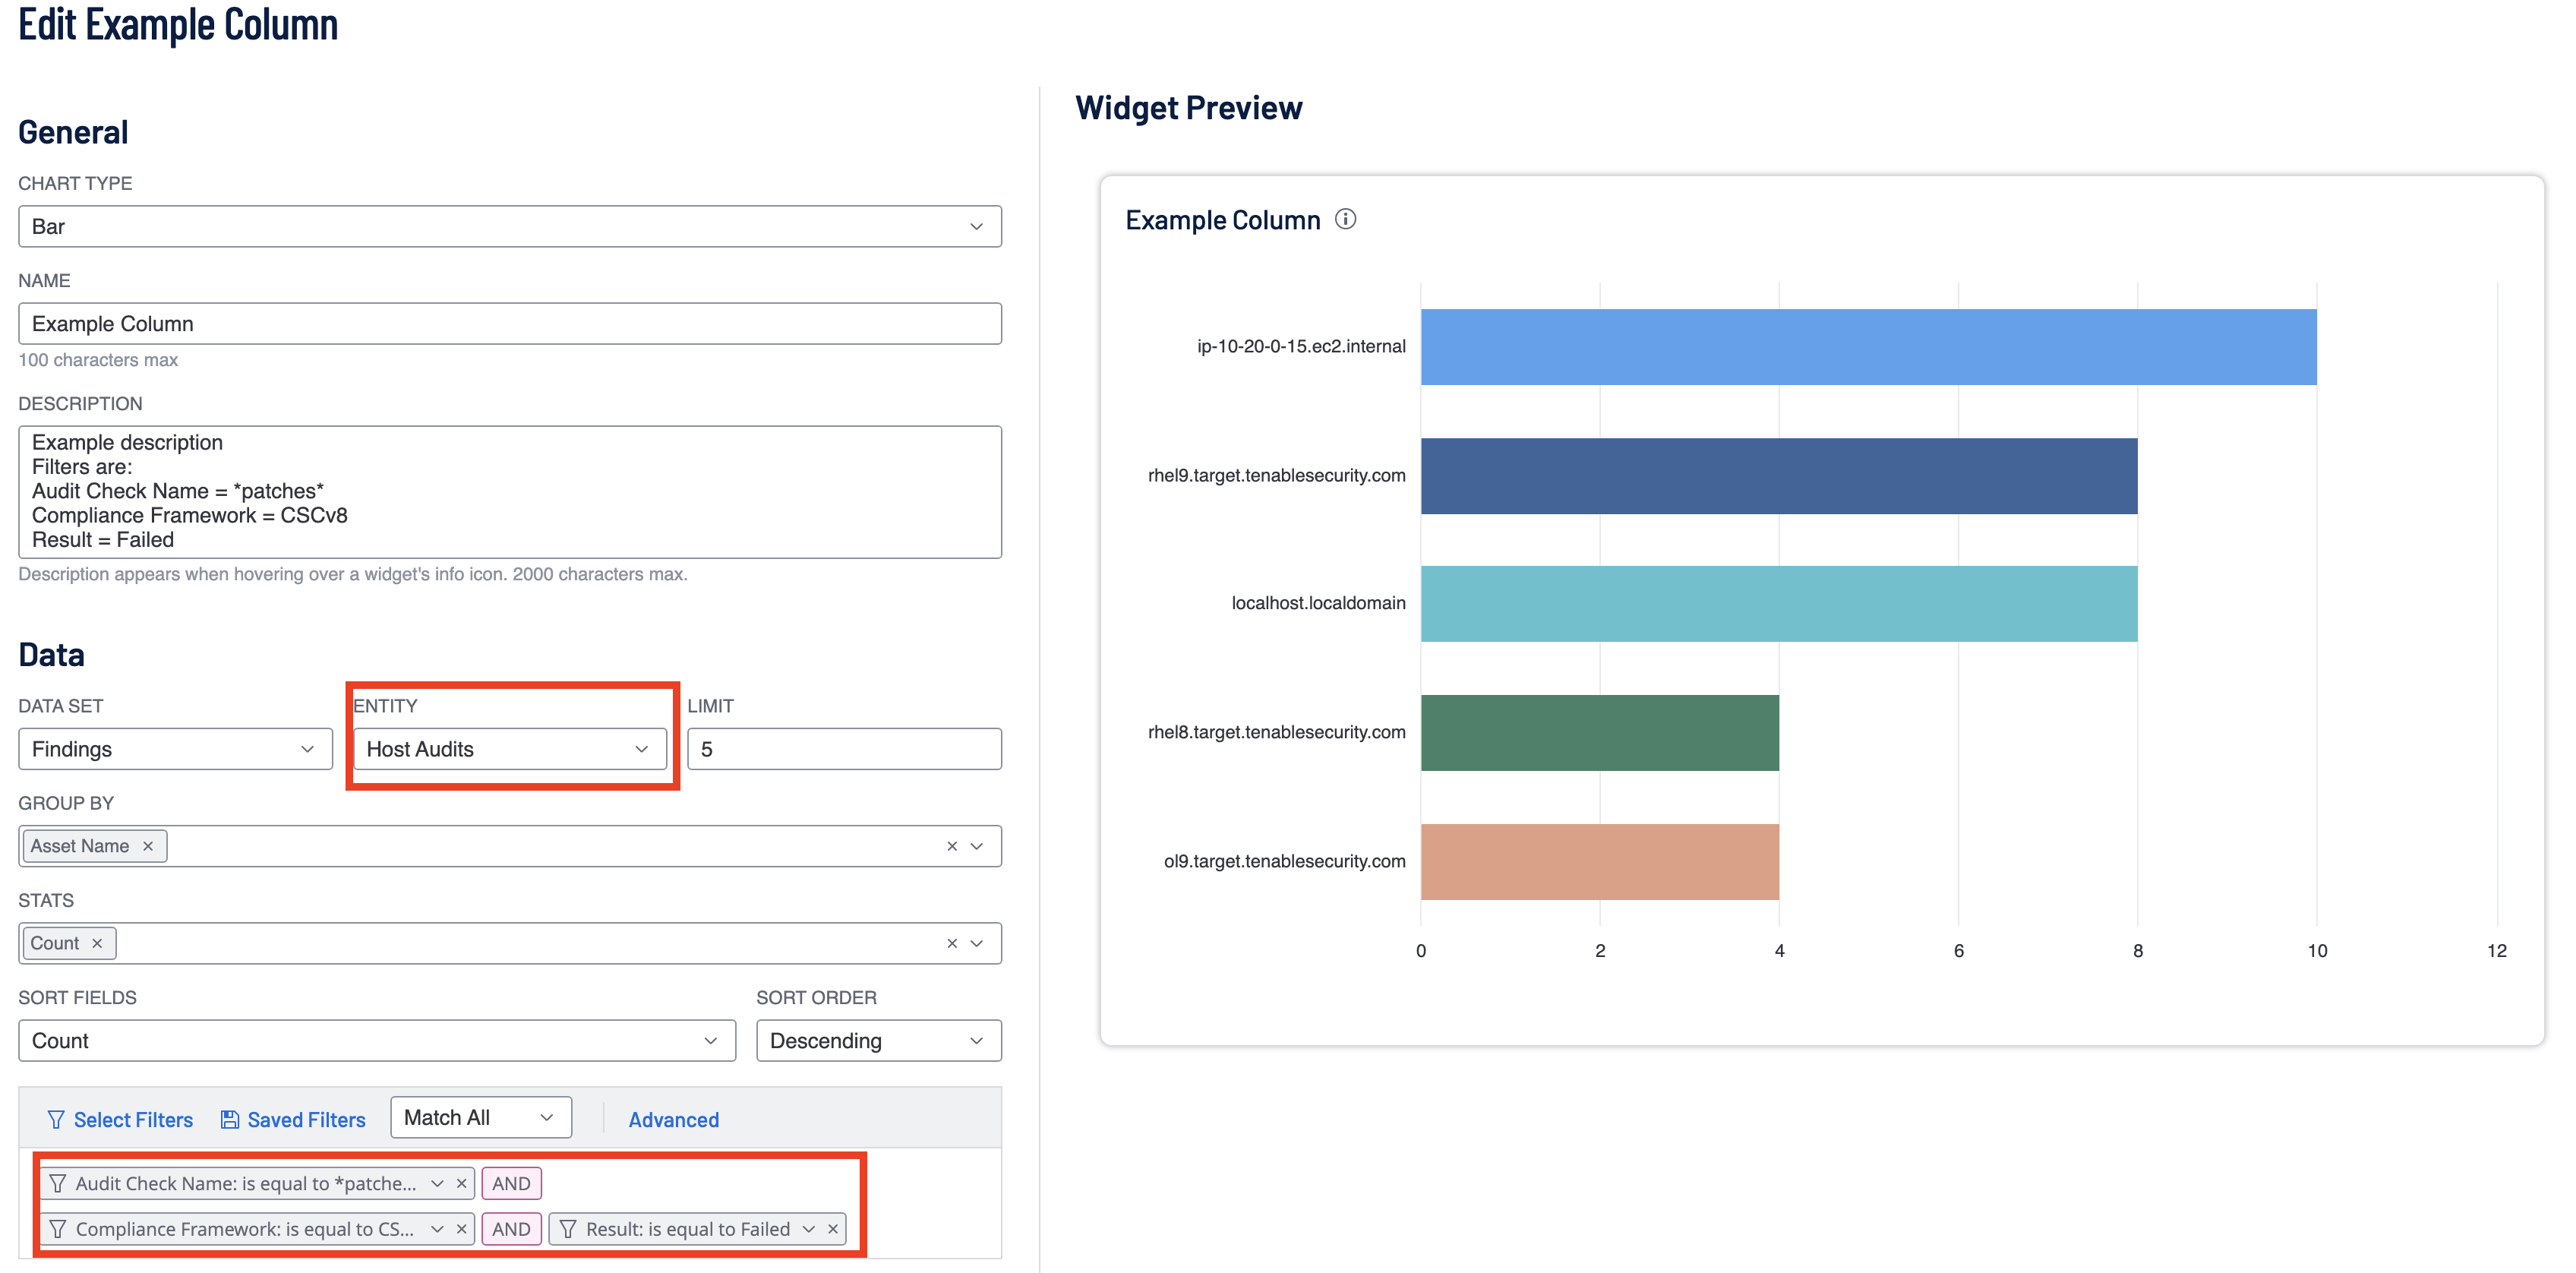
Tenable Vulnerability Management
Tenable Vulnerability Management has two available bar-like chart types for Host Audit Entity: Bar and Column. These two chart types function the same way with the only difference being the orientation of the bar; bar charts are horizontal and columns are vertical. The following example groups the results by Asset Name and sorts by count. This configuration of the widget allows the user to see which asset has the most failed audit checks which match the filters used.
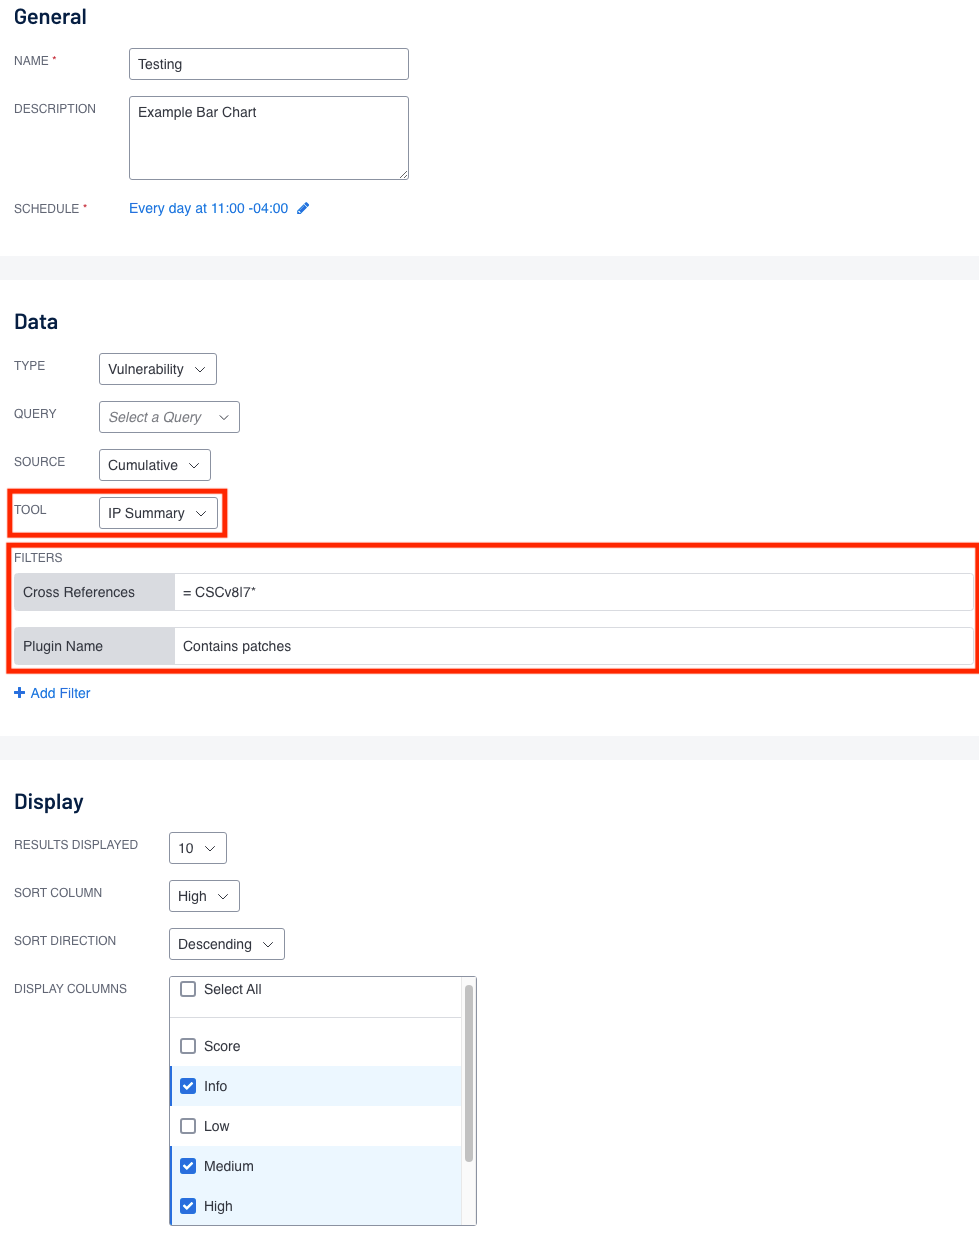
This example uses the IP summary tool to better match the example given above and to display the counts of audit checks separated by assets. The Columns chosen in the widget are Info, Medium, and High to include all possible result types in Compliance scans: Passed, Manual, and Failed.