Connector Logs
The following is not supported in Tenable FedRAMP Moderate environments. For more information, see the Tenable FedRAMP Product Offering.
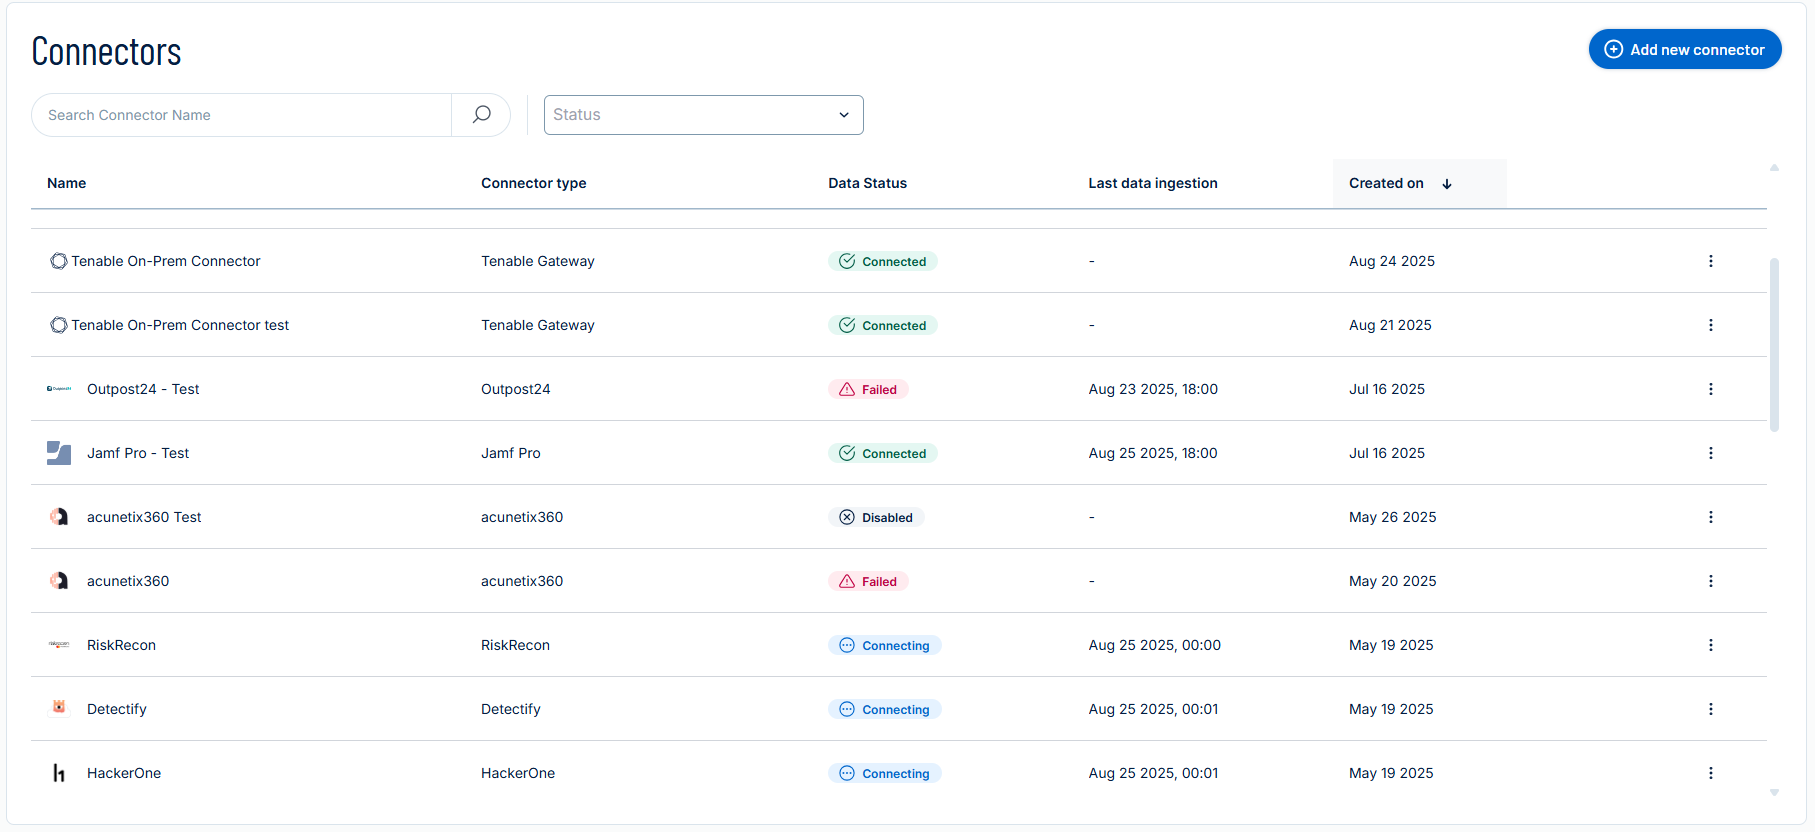
Tenable Exposure Management allows you to connect with third-party tools through connectors. To ensure visibility into sync operations, the platform includes a detailed Sync Log for each connector.
The Connector Logs in Tenable Exposure Management provide detailed insights into the processing lifecycle of your connectors.
You can use it to:
-
Track sync history and progress
-
Understand sync stages and timing
-
Identify failed syncs and troubleshoot issues
-
Filter log entries by Activity type, Data Stage, or Log Level.
Access Connector Logs
Required User Role: Administrator or Custom Role
To view connector's logs:
-
Navigate to the Connectors page.
-
In the table, for the connector for which you want to view logs, click the
 button.
A menu appears. -
In the menu, click Connector Logs.
The connector sync logs appear in a clear, user-friendly table. Each sync cycle is listed separately, allowing you to distinguish between different sync attempts.

Reading Connector Logs
Required User Role: Administrator or Custom Role
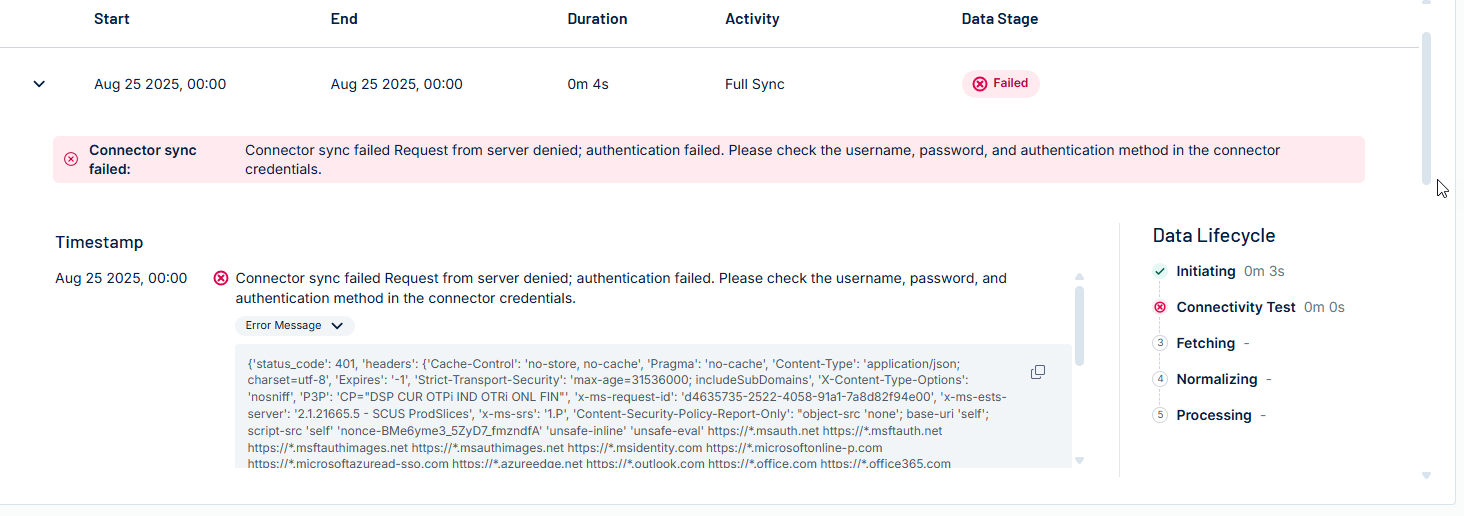
Select a sync row to expand it and view detailed information for troubleshooting. When a sync fails, the error message appears at the top of the expanded log with guidance on resolving the issue. You can also expand the full error payload to view the associated status code and headers.
The expanded view includes:
-
A readable error message with recommended actions
-
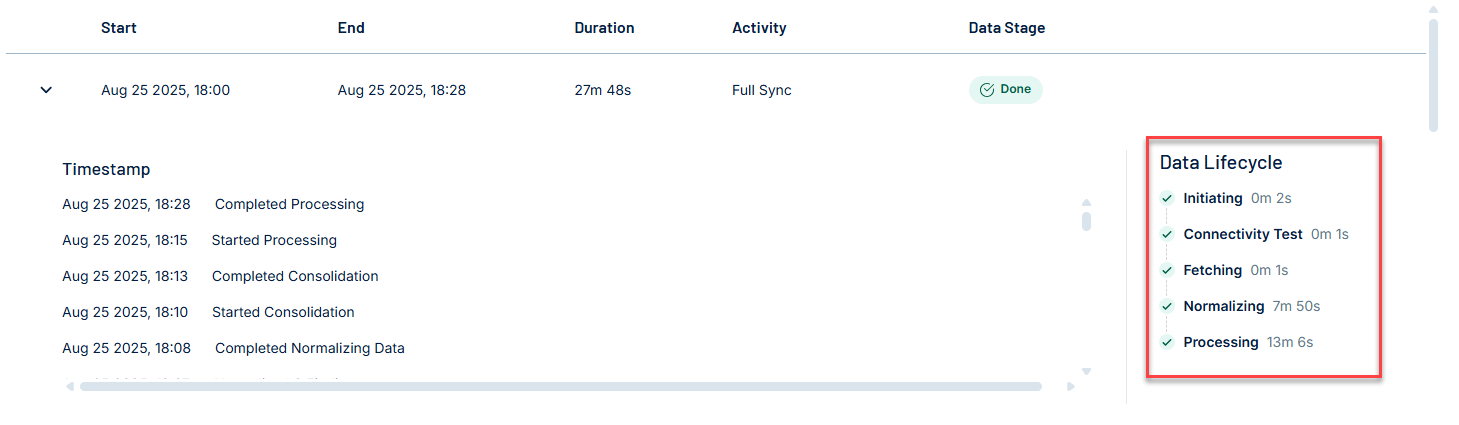
A breakdown of the Data Lifecycle stages (Initiating, Connectivity Test, Fetching, Normalizing, and Processing)
-
A full timestamp and error message block, including the root cause, error code (e.g., 'status_code: 401'), and technical details
-
A copy button for sharing or reporting error content
-
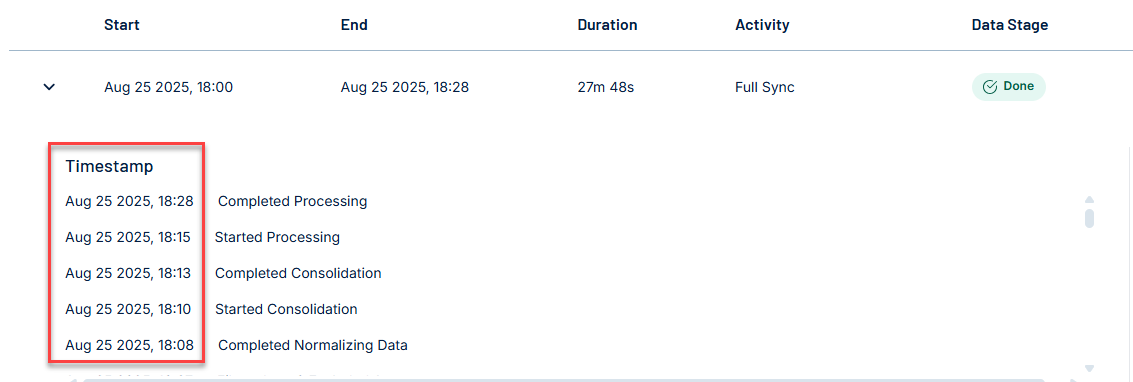
Each log entry includes the sync start and end time, activity type, status, and durations for data ingestion and processing.
Note: The connector logs table retains sync data for 14 days, providing extended visibility into recent sync activity.
Log Time Stamp
Log timestamps use your local browser time zone to ensure alignment with your environment.
Activity (Sync) Type
Tenable Exposure Management's data synchronization process with vendor connectors can be categorized into two distinct types: Full Sync and Incremental Sync.

-
Full Sync: A Full Sync pulls all available data from the vendor’s system and ingests it into Tenable Exposure Management. This ensures that the platform has a complete, up-to-date view of the data supported by the connector.
-
Incremental Sync: An Incremental Sync retrieves only new or changed records since the last successful sync. This method is used with connectors that support segmented or delta-based data retrieval, improving performance and reducing API consumption.
Data Stage (Sync Status)
Each connector sync is assigned a high-level status.
This status appears in the Connector's log.

|
Data Stage |
Description | Notes |
|---|---|---|
| Done |
|
You can confirm data was successfully ingested and reflected. |
| In Progress |
|
Check logs live to monitor what stage the sync is currently in and how long it's taking. |
| Failed |
|
Open the Sync Log and review the failed stage to troubleshoot. |
Data Lifecycle Stages
Each connector sync goes through a structured set of backend stages. These stages are visible when expanding a sync log, allowing you to understand what happens during each part of the sync and where failures may occur.
|
Stage |
Description | Notes |
|---|---|---|
| Initiating |
|
Possible Failures: Invalid credentials, expired tokens, network/authorization errors.
|
| Connectivity Test |
|
This step is critical for establishing trust before any data is pulled. Possible Failures:
|
| Fetching |
|
This is often the longest stage, especially for high-volume connectors (e.g., cloud or endpoint sources). Possible Failures:
|
| Normalizing |
|
The purpose of this stage is to ensure consistency across all data sources for unified presentation in Inventory, Exposure View, and Analytics. Possible Failures:Internal issues in syncing data. |
| Processing |
Enriches the normalized data with:
Connects findings to asset records. |
This is the final staging layer before data becomes visible in the platform. Possible Failures:
|