Patching Analytics has five separate dashboard views. Each view looks at patching information in the environment from a distinct perspective and shows summary information for related status.
All times in these graphs use the date information provided in the calendar settings (refer to Date Range, Export, and Refresh).
For tables in any dashboard view, the drop-down list next to Search allows you choose a column to search within. This provides several options for searching depending on the search term you have selected. Column choices change depending on the menu object.

The Overview summarizes the state of all patches in the environment. This view includes Patch Status and Product Status widgets.
Patch Status shows the total number of patches required in your environment and the installation/applicability of the aggregate total.

|
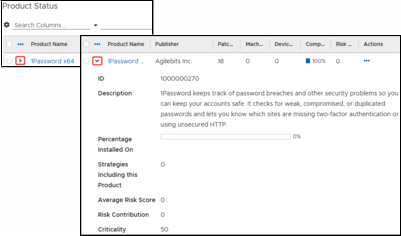
Product Status is a table that lists each product that TPM looks for during a scan, the installation/applicability status of each, and the status, compliance, and Risk Score for each.
The right arrow next to a product in the status table drops down a list of additional details for that product.
|
The Products view summarizes information from the product perspective.
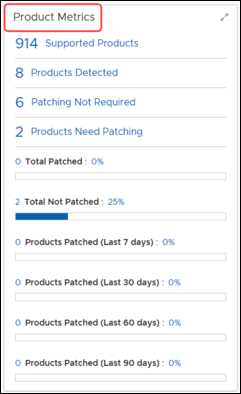
Product Metrics tracks supported products, detected products, and patching requirements, and provides a visual indication of product patching over time.
|
Product Compliance Rates show the number of products in the environment and the compliance rates by percentage. It also includes a chart that shows the level of compliance (Compliant, Compliant by Exclusions, and Non-Compliant) over time.

|
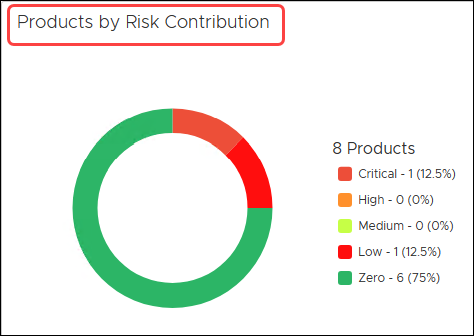
Risk Contribution shows the number of products in the environment and the risk rates (Critical, High, Medium, Low, Zero) by percentage. The chart tracks risk levels over time.
Active Product Deployments for products provides the number of products undergoing patch and the percentage of completion.

|
Product Status is a table that lists each product that TPM looks for during a scan, the installation/applicability status of each, and the status, compliance, and Risk Score for each.
The right arrow next to a product in the status table drops down a list of additional details for that product.
|
|
The Patches view summarizes information from the patch perspective.
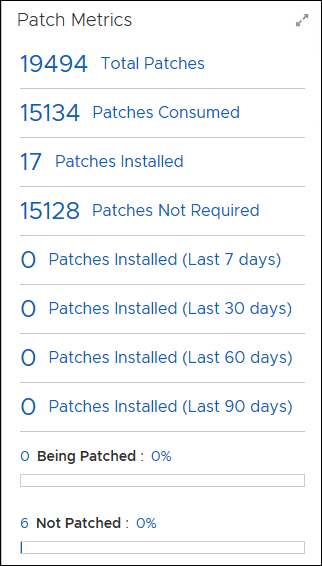
Patch Metrics tracks total patches, patches consumed, installed, or not required, and provides a visual indication of patch installation over time.
|
Active Product Deployments provides the number of patches undergoing installation and the percentage of completion.

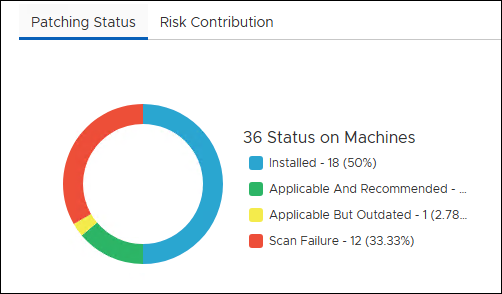
Patch Trends includes two tabs, one for Patching Status and one for Risk Contribution.

|
Patching Status shows the status of all patches, the number of machines tracked in the environment, and the number of patches in each status (Installed, Applicable and Recommended, Applicable but Outdated, Scan Failure) by percentage. The chart shows patching status over time.
|
Risk Contribution shows the number of patches in the environment and the risk rates (Critical, High, Medium, Low, Zero) by percentage. The chart tracks risk levels over time.

|
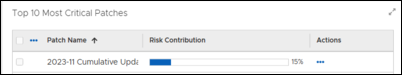
Top 10 Most Critical Patches tracks the risk contribution of the top ten most critical patches in the environment.
|
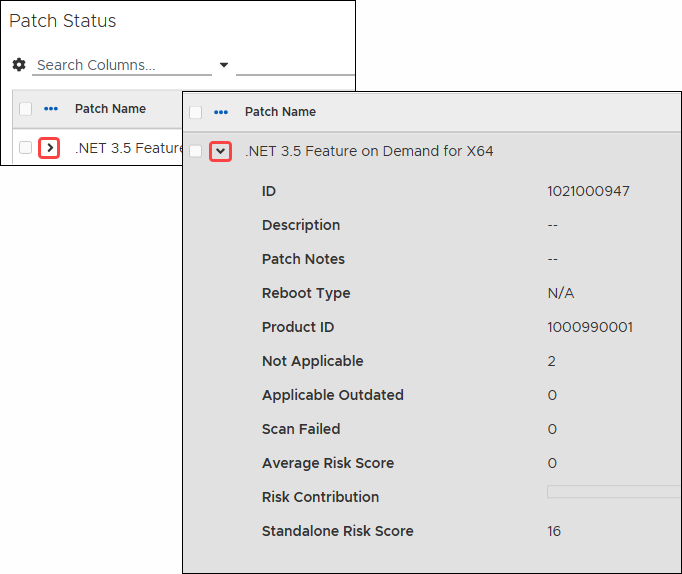
Patch Status is a table that lists each patch that TPM looks for during a scan, the installation/applicability status of each, and the status, compliance, and Risk Score for each.
The right arrow next to a product in the status table drops down a list of additional details for that product.
|
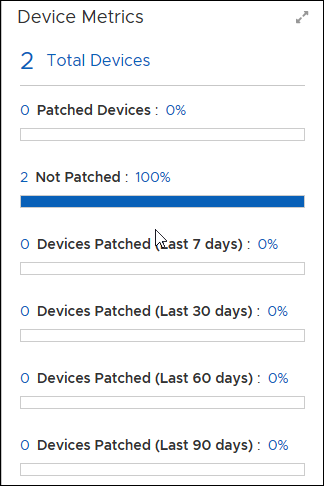
The Device Metrics widget shows the total number of devices in the environment, the percentage of patched and unpatched devices, and the percentage of devices patched in the last 7-, 30-, 60-, and 90-days.
|
The Product Compliance Rates for Devices shows the rate of compliance for each device in the environment based on the latest device scan information. The graph displays the percentage of devices that fall into each category of compliance (max, high, medium, low, and zero), and the line graph shows compliance trends over time.

|
The Risk Contribution widget for Devices shows the total number of devices and the percentage that fall into each risk category (critical, high, medium, low, zero). The chart shows risk contribution trends over time.

|
Active Product Deployments for devices provides the number of devices undergoing patch and the percentage of completion.
|
|
The Device Status table lists the device name of every device in the environment and shows a customizable view of the various details related to each device.

|