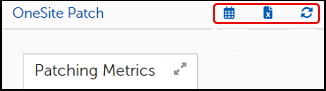
The three small icons (Calendar, Export and Refresh) on the upper right of the Home page and on any of the Patching Analytics pages (Overview, Products, Patches, or Devices) provide options to customize the date settings to a particular date range, choose some or all widgets on the page for exporting data, and refresh the data shown on the page.
The dashboard Date Settings default to the current day. Use the following steps to change the date settings:
-
Select
 on the upper-right of the Home page or from any Patching Analytics page.
-
Enter the starting and ending dates for the range you want to view or use the calendar icon to the right of each date field to choose a date from the calendar.

-
Select the Window Type setting, and then select whether to view data by Day, Week, Month, Quarter, or Year from the dropdown menu.
-
Select Update to save the settings. The view details update automatically for the date range you entered.
-
Select
 on the upper-right of the Home page or on any Patching Analytics page. This changes the view to an Export Data page, which highlights in gray the widgets you can export.
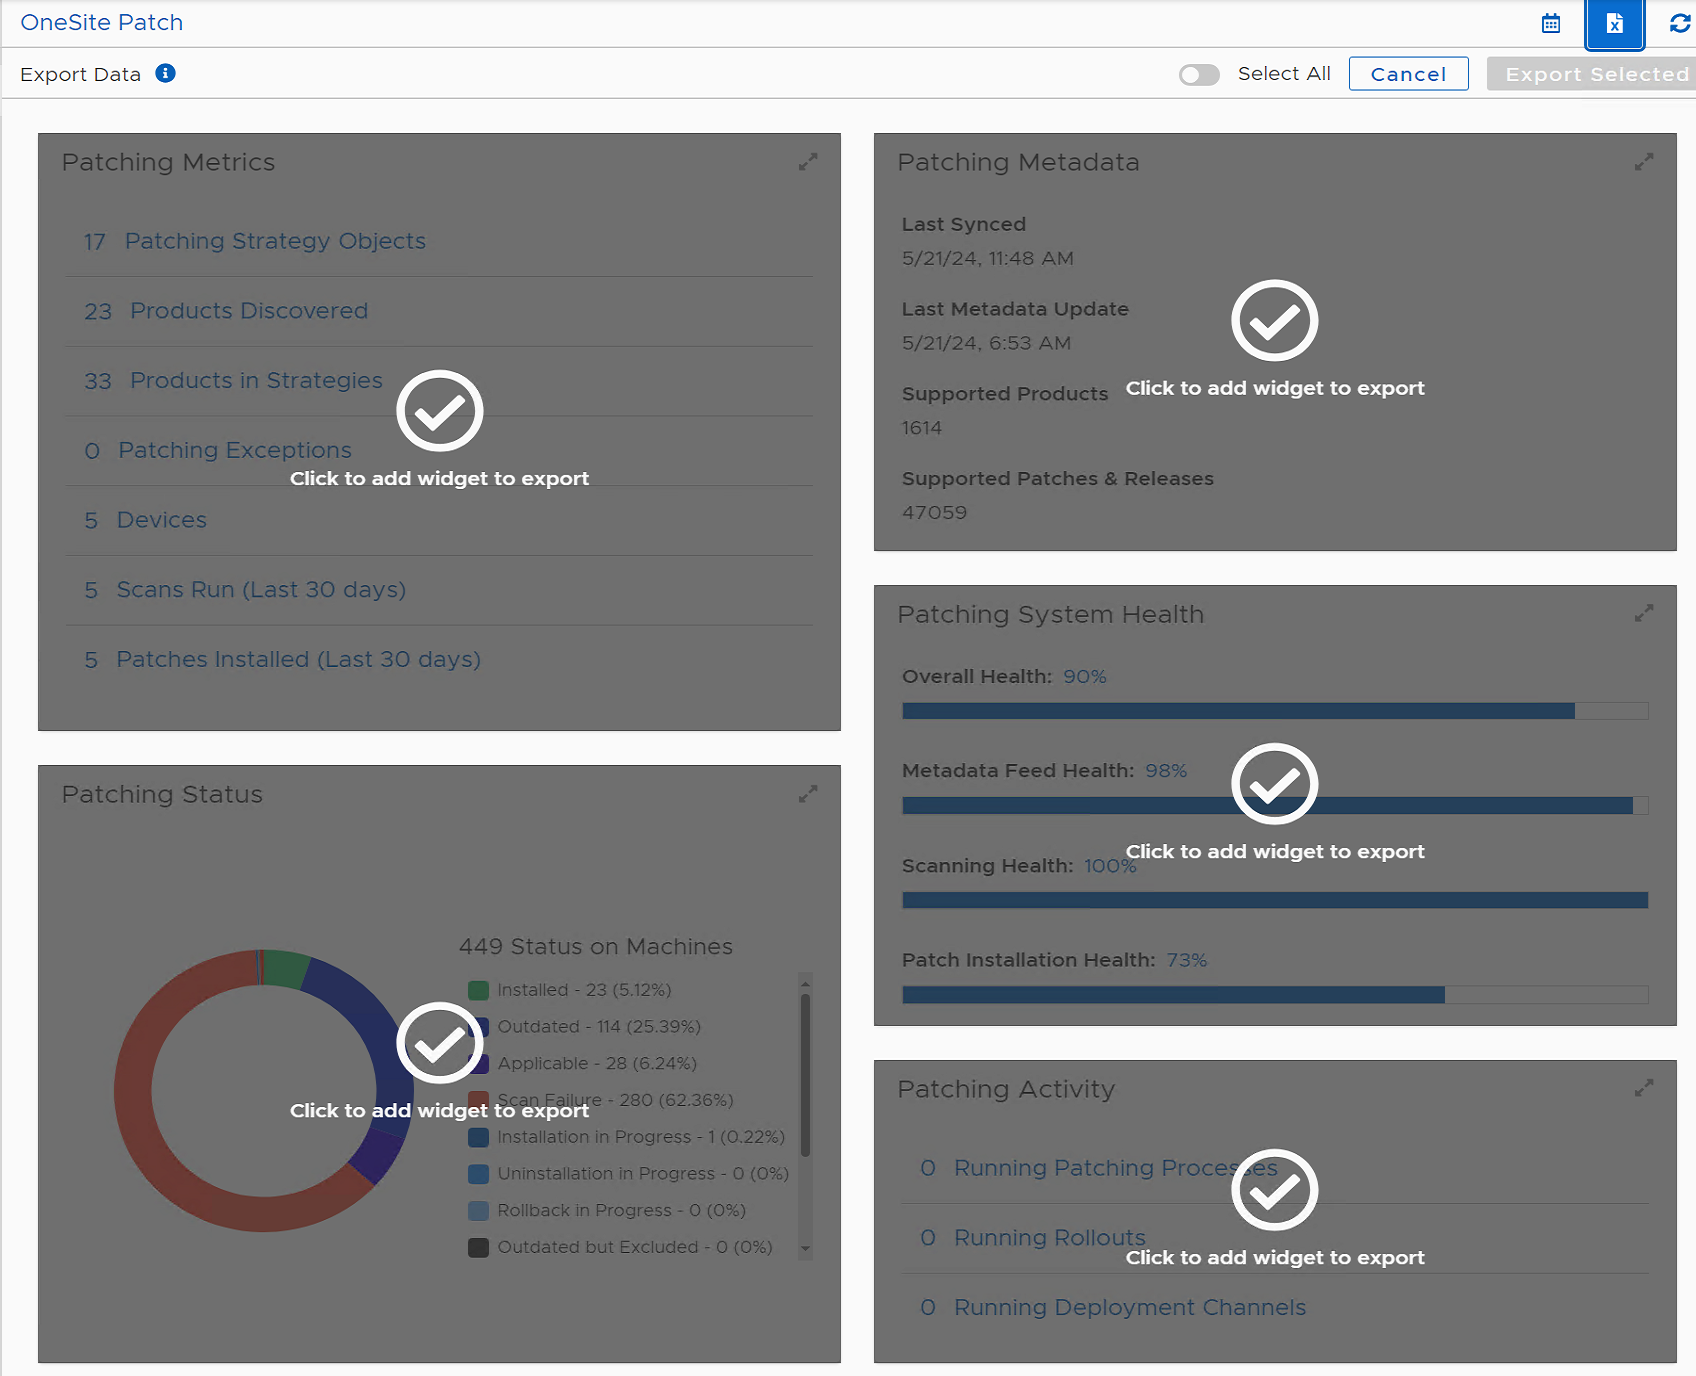
-
Choose which widgets to export:
-
Select Select All at the top of the page to export all widgets.
-
Select an individual widget to export a single widget, or select multiple widgets to export.

-
-
Select Export Selected on the upper-right. The system downloads the export to the server with an
.xlsxextension.

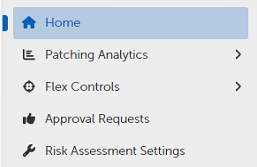
The left navigation menu lists the object available for configuring or monitoring in the TPM product. Those items with additional choices include a pop-out menu indicated by a right-angle bracket ( > ).
The left pane stays the same, regardless of which object you choose, and consists of three sections.
Home menu choices provide status information related to products, patches, devices, deployment, and approval requests, as well as access to settings for Risk Assessment and Flex Controls. Flex Controls contain tools that an administrator can use to monitor cycle operations, create patching exceptions, and pause or roll back patching strategies (refer to Home Menu Object Descriptions).
Administrators use this information to review performance and to help prioritize actions required to keep the environment updated, compliant, and risk free.
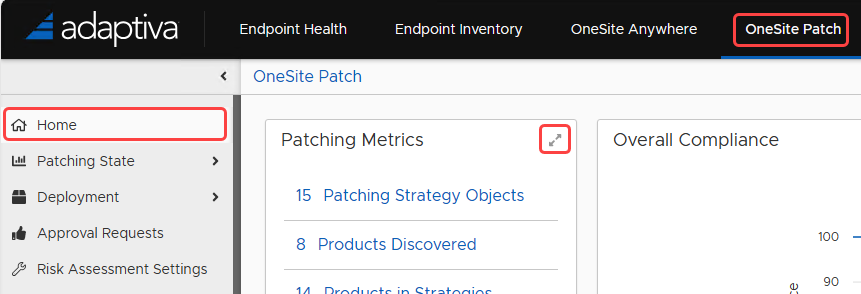
From any location within TPM, select Home to return to the Home page. For a description of Home page widgets, refer to Home dashboard and Performance Widgets.
|
Object |
Purpose |
|---|---|
|
Home |
Opens the Home page to view the overall status, metric, and compliance for patching in your environment. Refer to Tenable Patch Management ExpressDashboard and Performance Widgets. |
|
Patching Analytics |
Shows the status of patches and products in the environment. Change tabs to view metrics for Products, Patches, or Devices. Refer to Patching Analytics Dashboards. Sub menus include Overview, Products, Patches, and Devices. |
|
Flex Controls |
Review and manage settings for Blocklisting, Exceptions, Global Pause, and Rollbacks. Review Patching Cycle statistics (Cycle Operations), and view both running and historic cycles for Patching, Deployment, and Rollout. For details on each selection, refer to Flex Controls |
|
Approval Requests |
View all approval requests and check the status of pending and completed requests. Refer to Approval Requests. |
|
Risk Assessment Settings |
Customize risk calculations and display risks in other dashboards. Refer to Risk Assessment Settings. |
The Home menu provides access to the status and statistical information you can use to analyze the performance and activities occurring in the estate by products, patches and devices. Flex Controls, Auto Remediation, and Patching Preferences provide configuration workspaces where you may customize specific Patch Express functionality.

From any location within Patch Express, select Home to return to the Home page. For a description of Home page widgets, refer to Home Dashboard and Performance Widgets.
|
Object |
Purpose |
|---|---|
|
Home |
Opens the Home page to view the overall status, metric, and compliance for patching in your environment. Refer to Tenable Patch Management Express Dashboard and Performance Widgets. |
|
Patching Analytics |
Shows the status of patches and products in the environment. Change tabs to view metrics for Products, Patches, or Devices. Refer to Patching Analytics Dashboards. Sub menus include Overview, Products, Patches, and Devices. |
|
Flex Controls |
Review and manage settings for Blocklisting, Exceptions, Global Pause, and Rollbacks. Review Patching Cycle statistics (Cycle Operations), and view both running and historic cycles for Patching, Deployment, and Rollout. For details on each selection, refer to Flex Controls |
|
Approval Requests |
View all approval requests and check the status of pending and completed requests. Refer to Approval Requests. |
|
Auto Remediation |
Use this menu to enable and configure Auto Remediation details for security issues based on level of criticality (Critical, High, Medium, Low). Configure and test production deployment settings. |
|
Patching Preferences |
Create patching preferences based on target Business Unit including assignment of a Maintenance Window and User Interaction settings. |
The Intent Schema Menu refers to the menu items administrators use to customize and manage patching policies for Business Units.

|
Object |
Purpose |
|---|---|
|
Business Units |
Logically group and manage devices, settings, and other resources within a hierarchy. Refer to Business Units |
|
Maintenance Windows |
Define maintenance and reboot windows. Primarily associated with Business Unit configurations. Refer to Maintenance Windows. |
|
User Interaction Settings |
Control what the endpoint user sees and what options they have for interacting with patching notifications and required reboots. Refer to User Interaction Settings. |
|
Customized Products |
Customization of installation for products with specific actions needed, such as license key entry or custom installation locations, before or after an installation. Refer to Customized Products. |

The TPM Home page shows several widgets that provide patching details for the environment. You can expand each widget to a full page using the  icon at the upper-right corner of each widget.
|
The layout of these widgets depends on the size of your computer monitor.
Collectively, these widgets supply information about the overall state of patches in your environment based on TPM system scans. The Patching Analytics menus show more detail about specific products, patches, and devices.
Accessed from the Home screen, Patching Metrics show basic patch related information specific to your environment based on scanning requirements. Details include a quantitative summary of the item within the environment. Each item links to the Patching Analytics Overview, which includes a separate and detailed view for Products, Patches, or Devices.

|
Provides an aggregate view of patching statuses reported in the environment, including the combined total of statuses from all machines. The percentages that follow indicate the proportion of reported statuses that fall into each category.

|
Graphs the overall compliance of devices in the environment with the patch requirements.

|
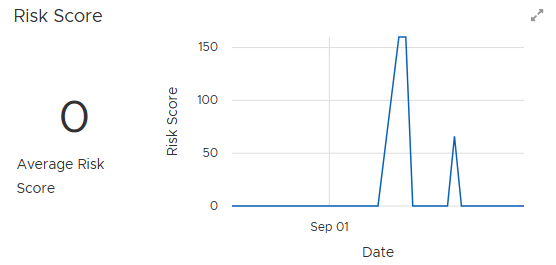
Returns the average risk score for all products identified in the metadata, and shows the average Risk Score. Depending on the dates chosen for the dashboard reporting, the administrator can view the changes in risk over time. Refer to Date Settings for Status Views for more information.
|
The average number reported here reflects a customized risk assessment for each product based on patch status, applicability, and weight of risk. Refer to Risk Assessment Settings for more information.
Summarizes the status of the latest endpoint scans and client product inventory updates. Metadata includes details about the products, patches, and updates approved by the company for installation. The Patch Metadata summary tells the administrator when the AdaptivaServer and AdaptivaClient last synchronized with the Metadata Server and when the last sync resulted in an update to the clients.

|
In addition, the Patching Metadata summary shows the number of supported products in the environment and the number of support patches and releases related to those supported products.
Shows the health of the overall patching system, including metadata feed, scanning, and patch installation. Use this information to identify any issues that require attention.

|
Shows a quantitative summary of the number of currently running patch processes, rollouts, and deployment channels in the environment.

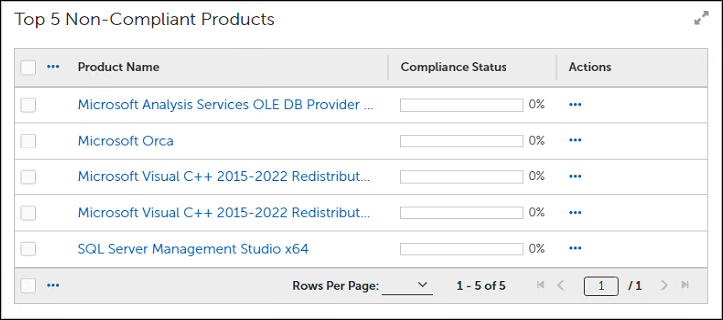
Displays the products that are most out of compliance and by what percentage. Scanning compares the detected product versions with the established current product version and reports the top five products contributing to the Overall Compliance score.
If compliance is the main area of concern, the administrator can review these top five products and take direct action to reduce their non-compliance.
Displays the most critical patches contributing to the Risk Score and by what percentage (highest to lowest). Scanning compares the risk score of missing patches and reports the top five as those contributing most to the Risk Score.

If risk is the main area of concern, the administrator can review each of these top five patches and take direct action to complete the updates and reduce the Risk Score.