Data Comparison
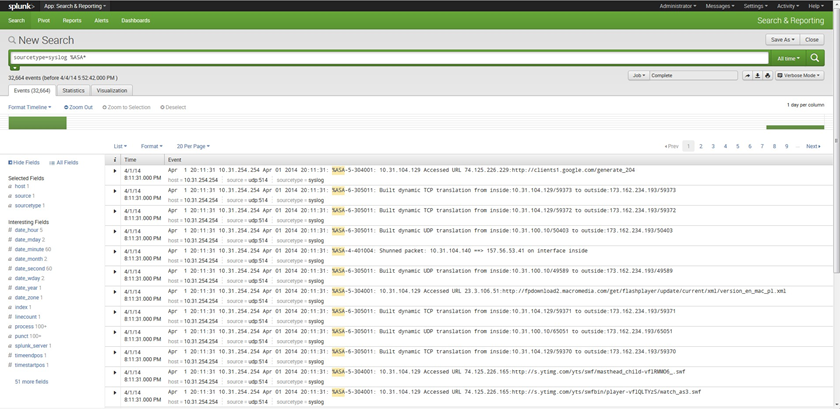
An example of the data shown in Splunk is shown below. The example shown contains search results for a Cisco ASA firewall. The exact search used narrowed the results to sourcetype=syslog, and matched the text string %ASA.
The same type of log information is available in Tenable Security Center. When a user logs into Tenable Security Center, there can be multiple dashboards available that display pertinent information for that user. It is possible to set a specific collection of dashboards as the default view in Tenable Security Center. Examples of dashboards that can be created for events that are collected by the Tenable Log Correlation Engine Splunk client.
The Splunk Events dashboard in the previous example contains a component named NormalizedEvent Types Collected by Splunk. Click ![]() beside that component to view all the information available.
beside that component to view all the information available.
The NormalizedEvent Types Collected by Splunk component on the Splunk Events dashboard includes the Cisco ASA Firewall events and all event types in a normalized format that is easy to interpret. There are several views that you can select on the Event Analysis page that can be displayed by selecting Normalized Event Summary. A view similar to that in Splunk can be seen by clicking the Raw Syslog Events link.
It is also possible to filter the Normalized Event Summary along with any other summary view by clicking  at the top left of the window. The text string %ASA used in the Splunk search could be typed in the Syslog Text box.