Dashboards Section
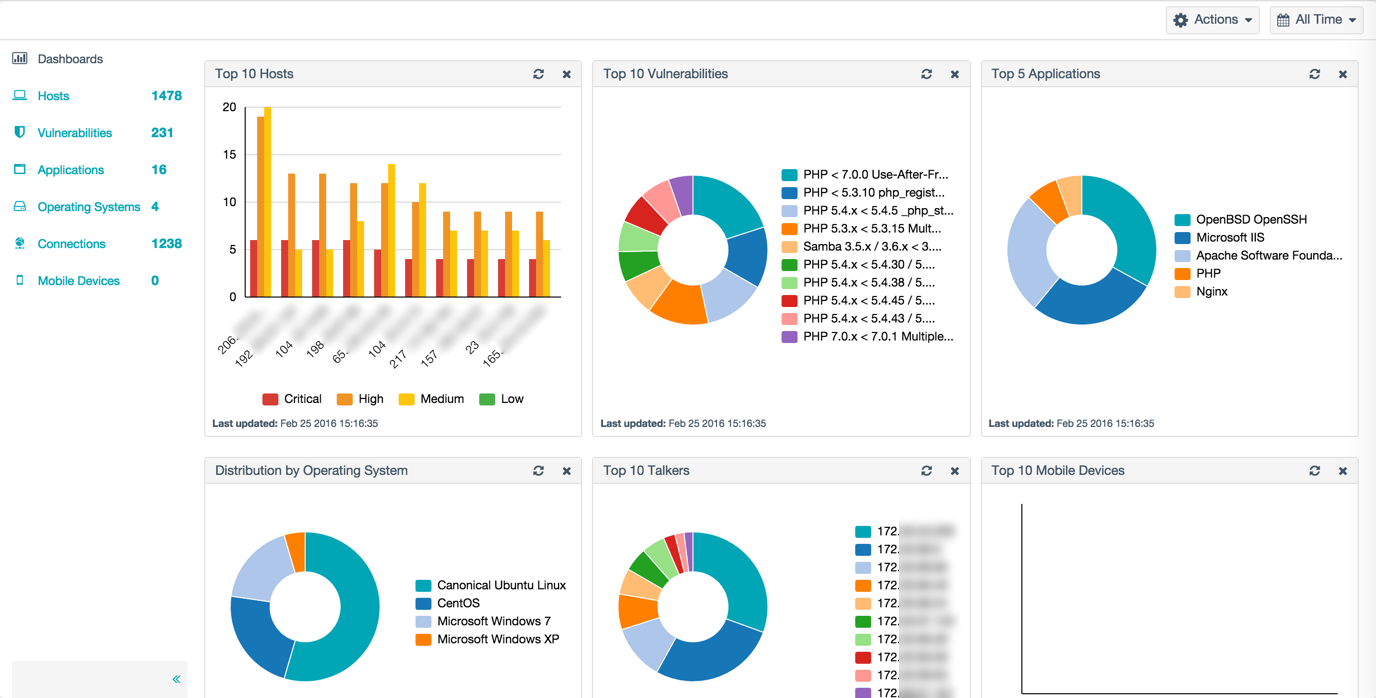
The Dashboards section displays the contents of the vulnerability tab in a graphical layout. The default dashboard layout displays the following charts:
-
Top 10 Hosts
-
Top 10 Vulnerabilities
-
Top 5 Applications
-
Distribution by Operating System
-
Top 10 Talkers
Note: The 10 Top Talkers chart only lists client machines that call or talk to the servers. If you are interested in viewing both servers and clients, enable the Enable Connection Analysis Module setting in the Tenable Network Monitor Settings Section.
-
Top 10 Mobile Devices
-
Distribution of Mobile Devices by Operating System
-
Top 10 Mobile Devices by Hardware
-
Distribution of Mobile Applications by Application
-
SCADA Vulnerability Distribution by Severity
-
Top 10 SCADA Hosts
-
SCADA Host Distribution by Protocol
-
SCADA Host Distribution by System Type
-
Client Connections
-
Network Bandwidth by Byte Count
-
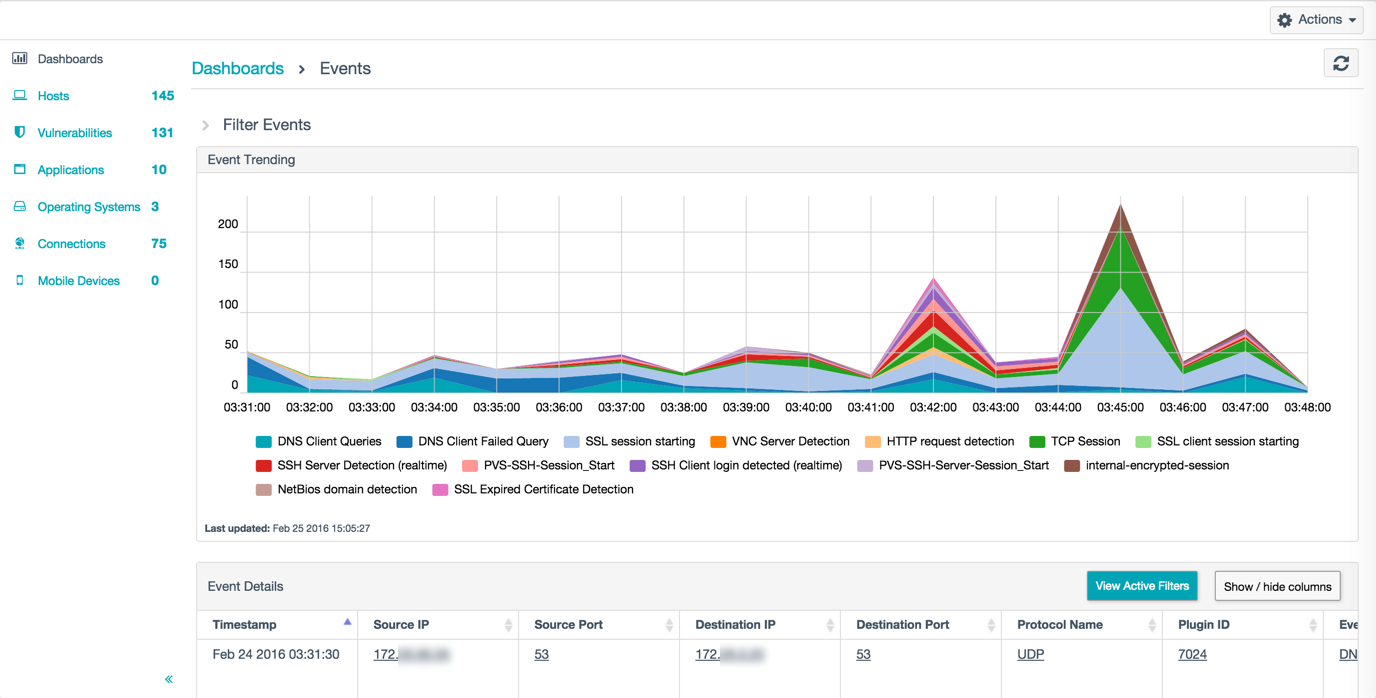
Event Trending
Note: Your Tenable Network Monitor configuration determines which charts appear in the Dashboards section.
Click on the data within a chart to see more information about the data. Additionally, you can drag-and-drop charts to rearrange them on the dashboard for the duration of your session. The
The following table describes the options available in the Dashboards section:
|
Option |
Description |
|---|---|
|
<click on the chart> |
Opens a Details section with more information about the data displayed in a chart. Note: You cannot click on the Top 10 Mobile Devices by Hardware chart. |
|
|
Removes the chart from the Dashboards section for the duration of your session. |
|
|
Refreshes the chart. |
|
|
Provides options to Export Results, Delete Results, or Launch Scan. |
|
|
Provides options to filter chart data based on a specified date range. |
Events Dashboard
Click on the Event Trending chart to Access the Events dashboard. The Events dashboard displays a graphical representation of the number of maximum viewable real-time events as defined in the Realtime Events setting type in the Tenable Network Monitor Settings section.
The Event Details table can be customized by sorting columns, showing or hiding columns, filtering content by clicking View Active Filters, or by clicking underlined columns in the table.

 button
 button
 button
 button