Create a Custom Chart
To create a custom chart:
-
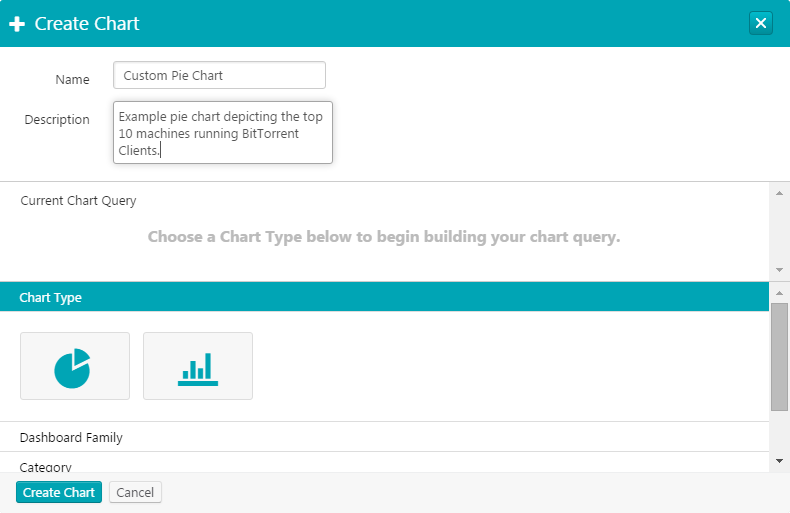
Click Configuration > Chart Settings > Create Chart.
The Create Chart window appears.
-
In the Name box, type a name for the chart.
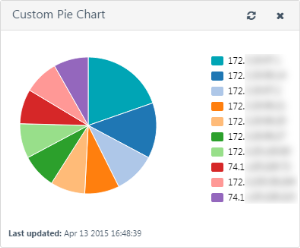
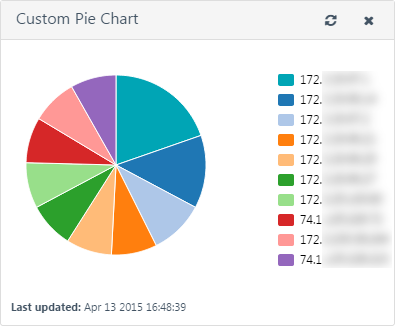
Note: In this example, we are creating a chart that displays the top vulnerabilities for machines reporting associated BitTorrent activity.
-
In the Description box, type a description for the chart.
-
In the Chart Type section, select the type of chart you want to create.
-
In the Dashboard Family section, type a numeric value between 1 and 20 that represents the number of items returned for this chart.
-
Click Top to add the value to the Current Chart Query section.
-
In the Category section, select a chart category. The selected category determines the type of items displayed on the chart, such as hosts, vulnerabilities, applications, operating systems, or connections.
-
In the Filters section, configure the options by which you want to filter the results.
Note: In this example, we are creating a filter based on the Plugin ID 3920. This triggers when BitTorrent client activity is detected.
-
Click the + button to apply the rule to the chart.
-
In the Viewable section, select whether you want the chart to appear on the main dashboard.
-
Click the Create Chart button. The chart appears in the Dashboards section of the Monitoring page.