Tenable One Web App Scanning
Enable Plugin Debugging and Audit Trails
Use this section when troubleshooting false positives, authentication errors, or compliance checks. Apply these settings before running the scan.
To enable plugin debugging and audit trails for Web App Scanning in Tenable Nessus Expert:
-
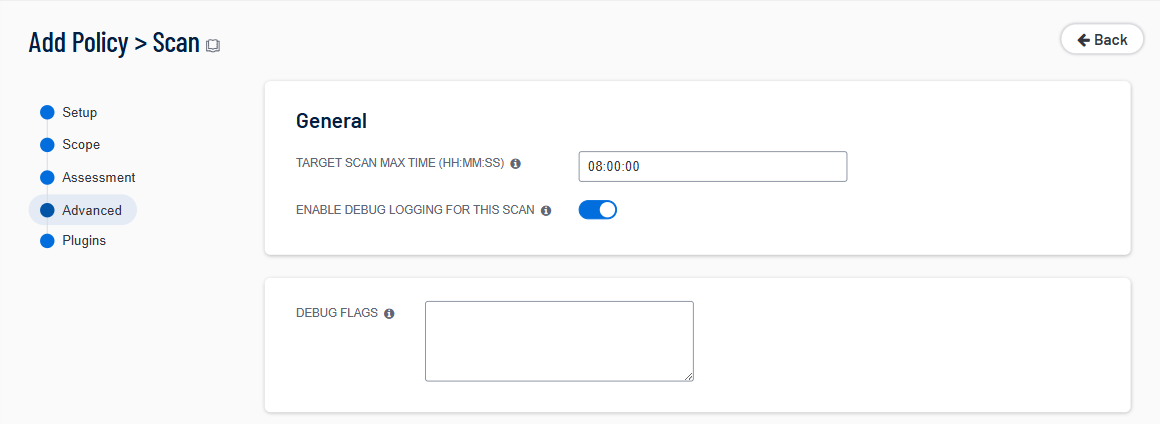
In Tenable Nessus Expert, in the policy, go to Advanced.
-
Select Enable Debug logging for this scan.
Leave flags empty unless instructed otherwise.

To enable plugin debugging and audit trails for Web App Scanning in Tenable Security Center:
-
In Tenable Security Center, go to Scans > Policies
-
In the table, select the scan policy.
-
In the Advanced section, select Enable Debug logging for this scan.
To enable plugin debugging and audit trails for Web App Scanning in Tenable One Vulnerability Management:
-
In Tenable One Web App Scanning, go to Scans.
-
In the table, select the scan.
The Edit a Scan window appears.
-
In the Advanced tab, select Enable Debug logging for this scan.

Collect Scan Results
Use this section after the scan has finished. These files allow support to replay the scan results with full diagnostic data.
To collect scan results for Web App Scanning in Tenable Nessus Expert:
-
In the top navigation bar, click Scans.
The My Scans page appears.
-
Click the scan, then click See All Details.
The scan details page appears.
-
In the upper-right corner, click Export.

-
Select Nessus DB.
-
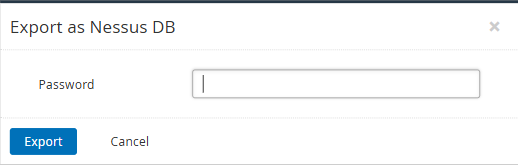
Type a password to protect the file.
-
Click Export.
Note: You must provide this password to Tenable Support.
-
-
Submit the downloaded file to your support case.
To collect scan results for Web App Scanning in Tenable One Vulnerability Management:
-
In the left navigation, click Scans.
-
Select the Web Application Scans tab (or filter) to locate your scan.
-
Do not open the scan details yet. Instead, look for the Export button or the
 menu next to the scan in the list.
 -
Select Export and select the Nessus format.

-
Set a password when prompted.
Collect Debug Logs
Use this section when troubleshooting software crashes, service failures, or installation errors.
To collect debug logs for Web App Scanning in Tenable Security Center:
-
In the left navigation, click System > Diagnostics.
The Diagnostics page appears.
-
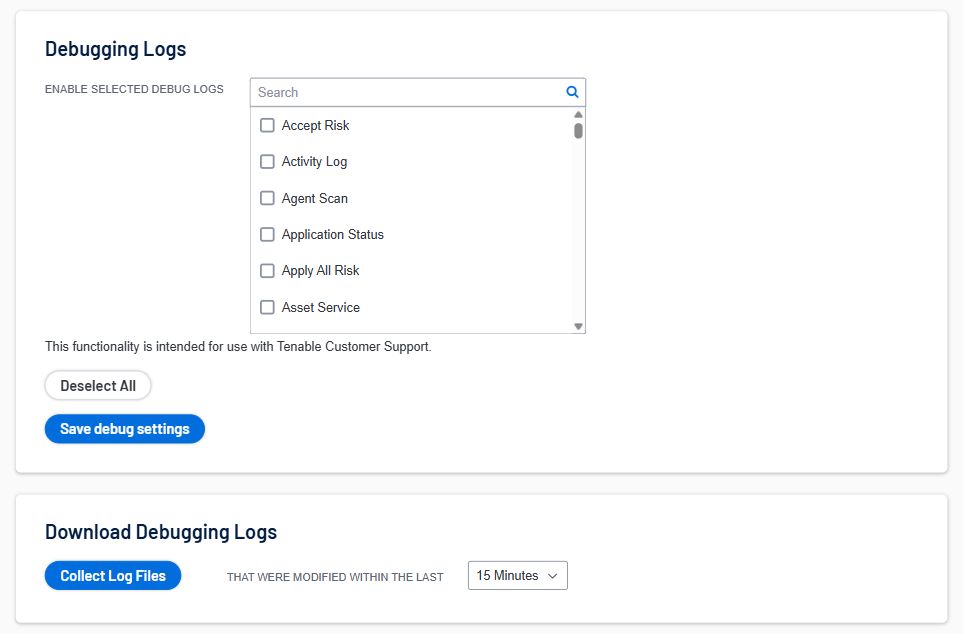
In the Debugging Logs section, select the debugging logs Tenable Support asked you to enable.
-
Click Save Debug Settings.
-
Reproduce the issue.
-
In the Download Debugging Logs section, click Collect Log Files.
-
Click Download Debug File.
-
Submit the file to your support case, then disable the debugging logs.