Configure a Charts Element in a Report
Required Tenable Security Center User Role: Organizational user with appropriate permissions. For more information, see User Roles.
Charts elements in Tenable Security Center reports include:
|
Option |
Description |
Relevant Reports |
|---|---|---|
|
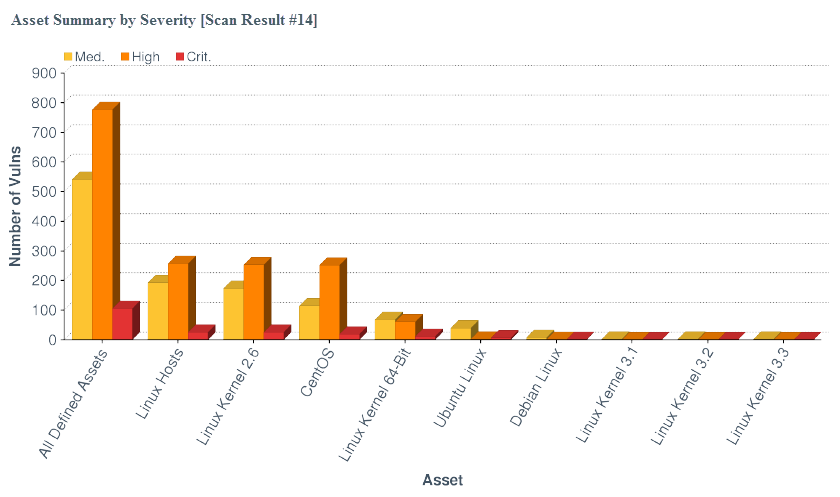
Bar Chart |
Click to add a bar chart element to the report.
|
|
|
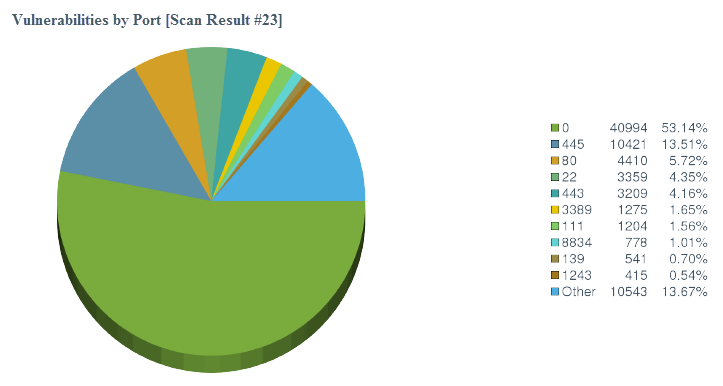
Pie Chart |
Click to add a pie chart element to the report.
|
|
|
Line Chart |
Click to add a line chart element to the report.
Line charts are defined by time (x-axis) and series data (y-axis). When selecting the time, available options include Relative time and Absolute time. One or more series data elements can be chosen and displayed as discrete lines for easy comparison. |
|
|
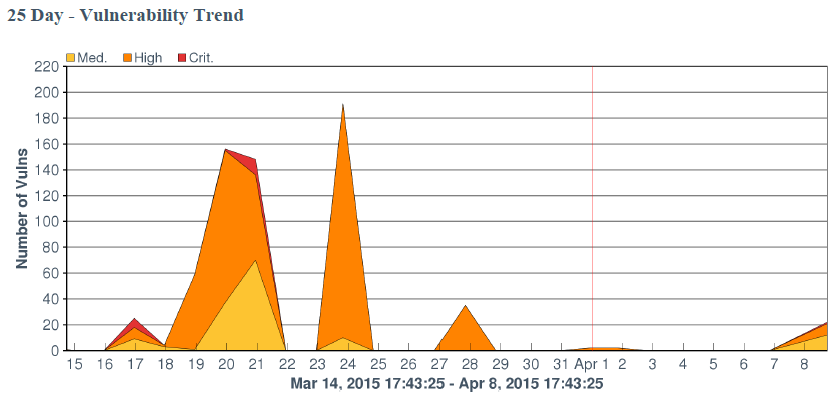
Area Chart |
Click to add an area chart element to the report.
Area charts are defined by time (x-axis) and series data (y-axis). When selecting the time, available options include Relative time and Absolute time. One or more series data elements can be chosen and displayed as a stackable view for easy comparison. |

To configure a chart element in a report:
-
In the left navigation, click Reporting > Reports.
The Reports page appears.
-
In the reports table, click the name of the report you want to edit.
-or-
Right-click the row for the report you want to edit, and click Edit.
The Edit Report page appears.
-
On the left side of the page, click Definition.
The report outline appears. This outline is, by default, expanded. For more information, see Edit a Report Outline.
- Do one of the following:
Add a chart element:
- Click Add Element to add an element.
- In the Charts section, click the icon for the type of chart you want to add.
Click the edit icon next to an existing chart element.
Tip: To display Add Element and the edit icon, hover the cursor over the element.
-
For all charts, configure the General options:
Option Action Name Type a name for the element. Location Select a location for the element in the report. Style Select a style for the element. -
For bar charts and pie charts, configure the following Data options:
Option Action Type Equivalent to the option the Definition option of the same name in Report Options. Query Source Tool Filters -
For line charts and area charts, configure the following Data options:
Option Action Data Type Valid values are Relative and Absolute. Use to configure the x-axis of the chart. Data Range Use to configure the x-axis of the chart:
- If you select Relative for Data Type, select a relative date range.
- If you select Absolute for Data Type, select a specific start and end date for the data.
Series Use to configure the y-axis of the chart. Line charts and area charts require that you configure at least one series. -
For bar charts and pie charts, configure the following Display options:
Option Action Results Displayed Equivalent to the Display option of the same name in Report Options. Sort Column Sort Direction Display Columns -
Click Submit to save your changes to the element.
- Click Submit to save your changes to the report.