License Information
On the License Information page, you can view a complete breakdown of your Tenable products and how many asset licenses they are using. You can view this information in multiple ways, including visual overviews by product or time period that enable you to spot trends such as temporary usage spikes or product misconfigurations.
This page is broken down into two tabs:
-
Asset License — License usage for all Tenable products in the current container.
-
Account Details — Organization-level details such as your account information.
Tip: For more information about licensing, see the following additional resources:
Licensing Tenable Products Quick Reference Guide
View the License Information Page
To view the License Information page:
-
In the left navigation, click
 Settings.
The Settings page appears.
-
Click the License tile.
The License Information overview appears. By default, the Asset License tab is active.
Asset License
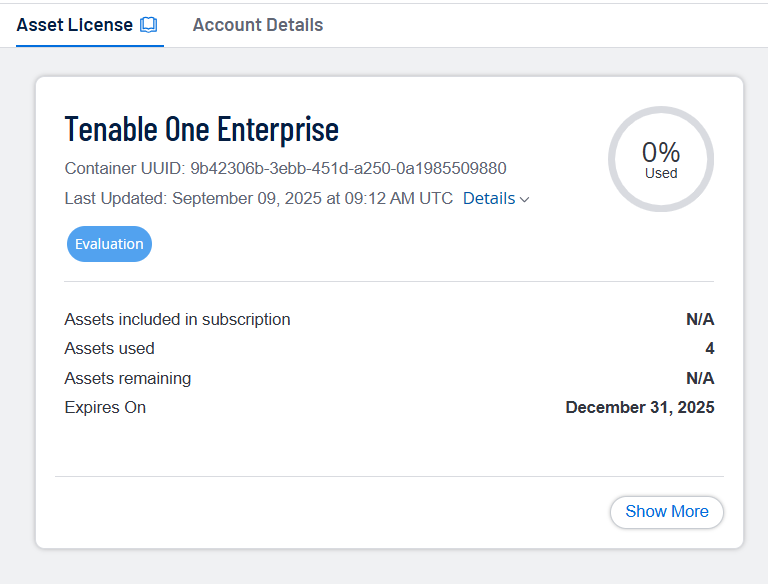
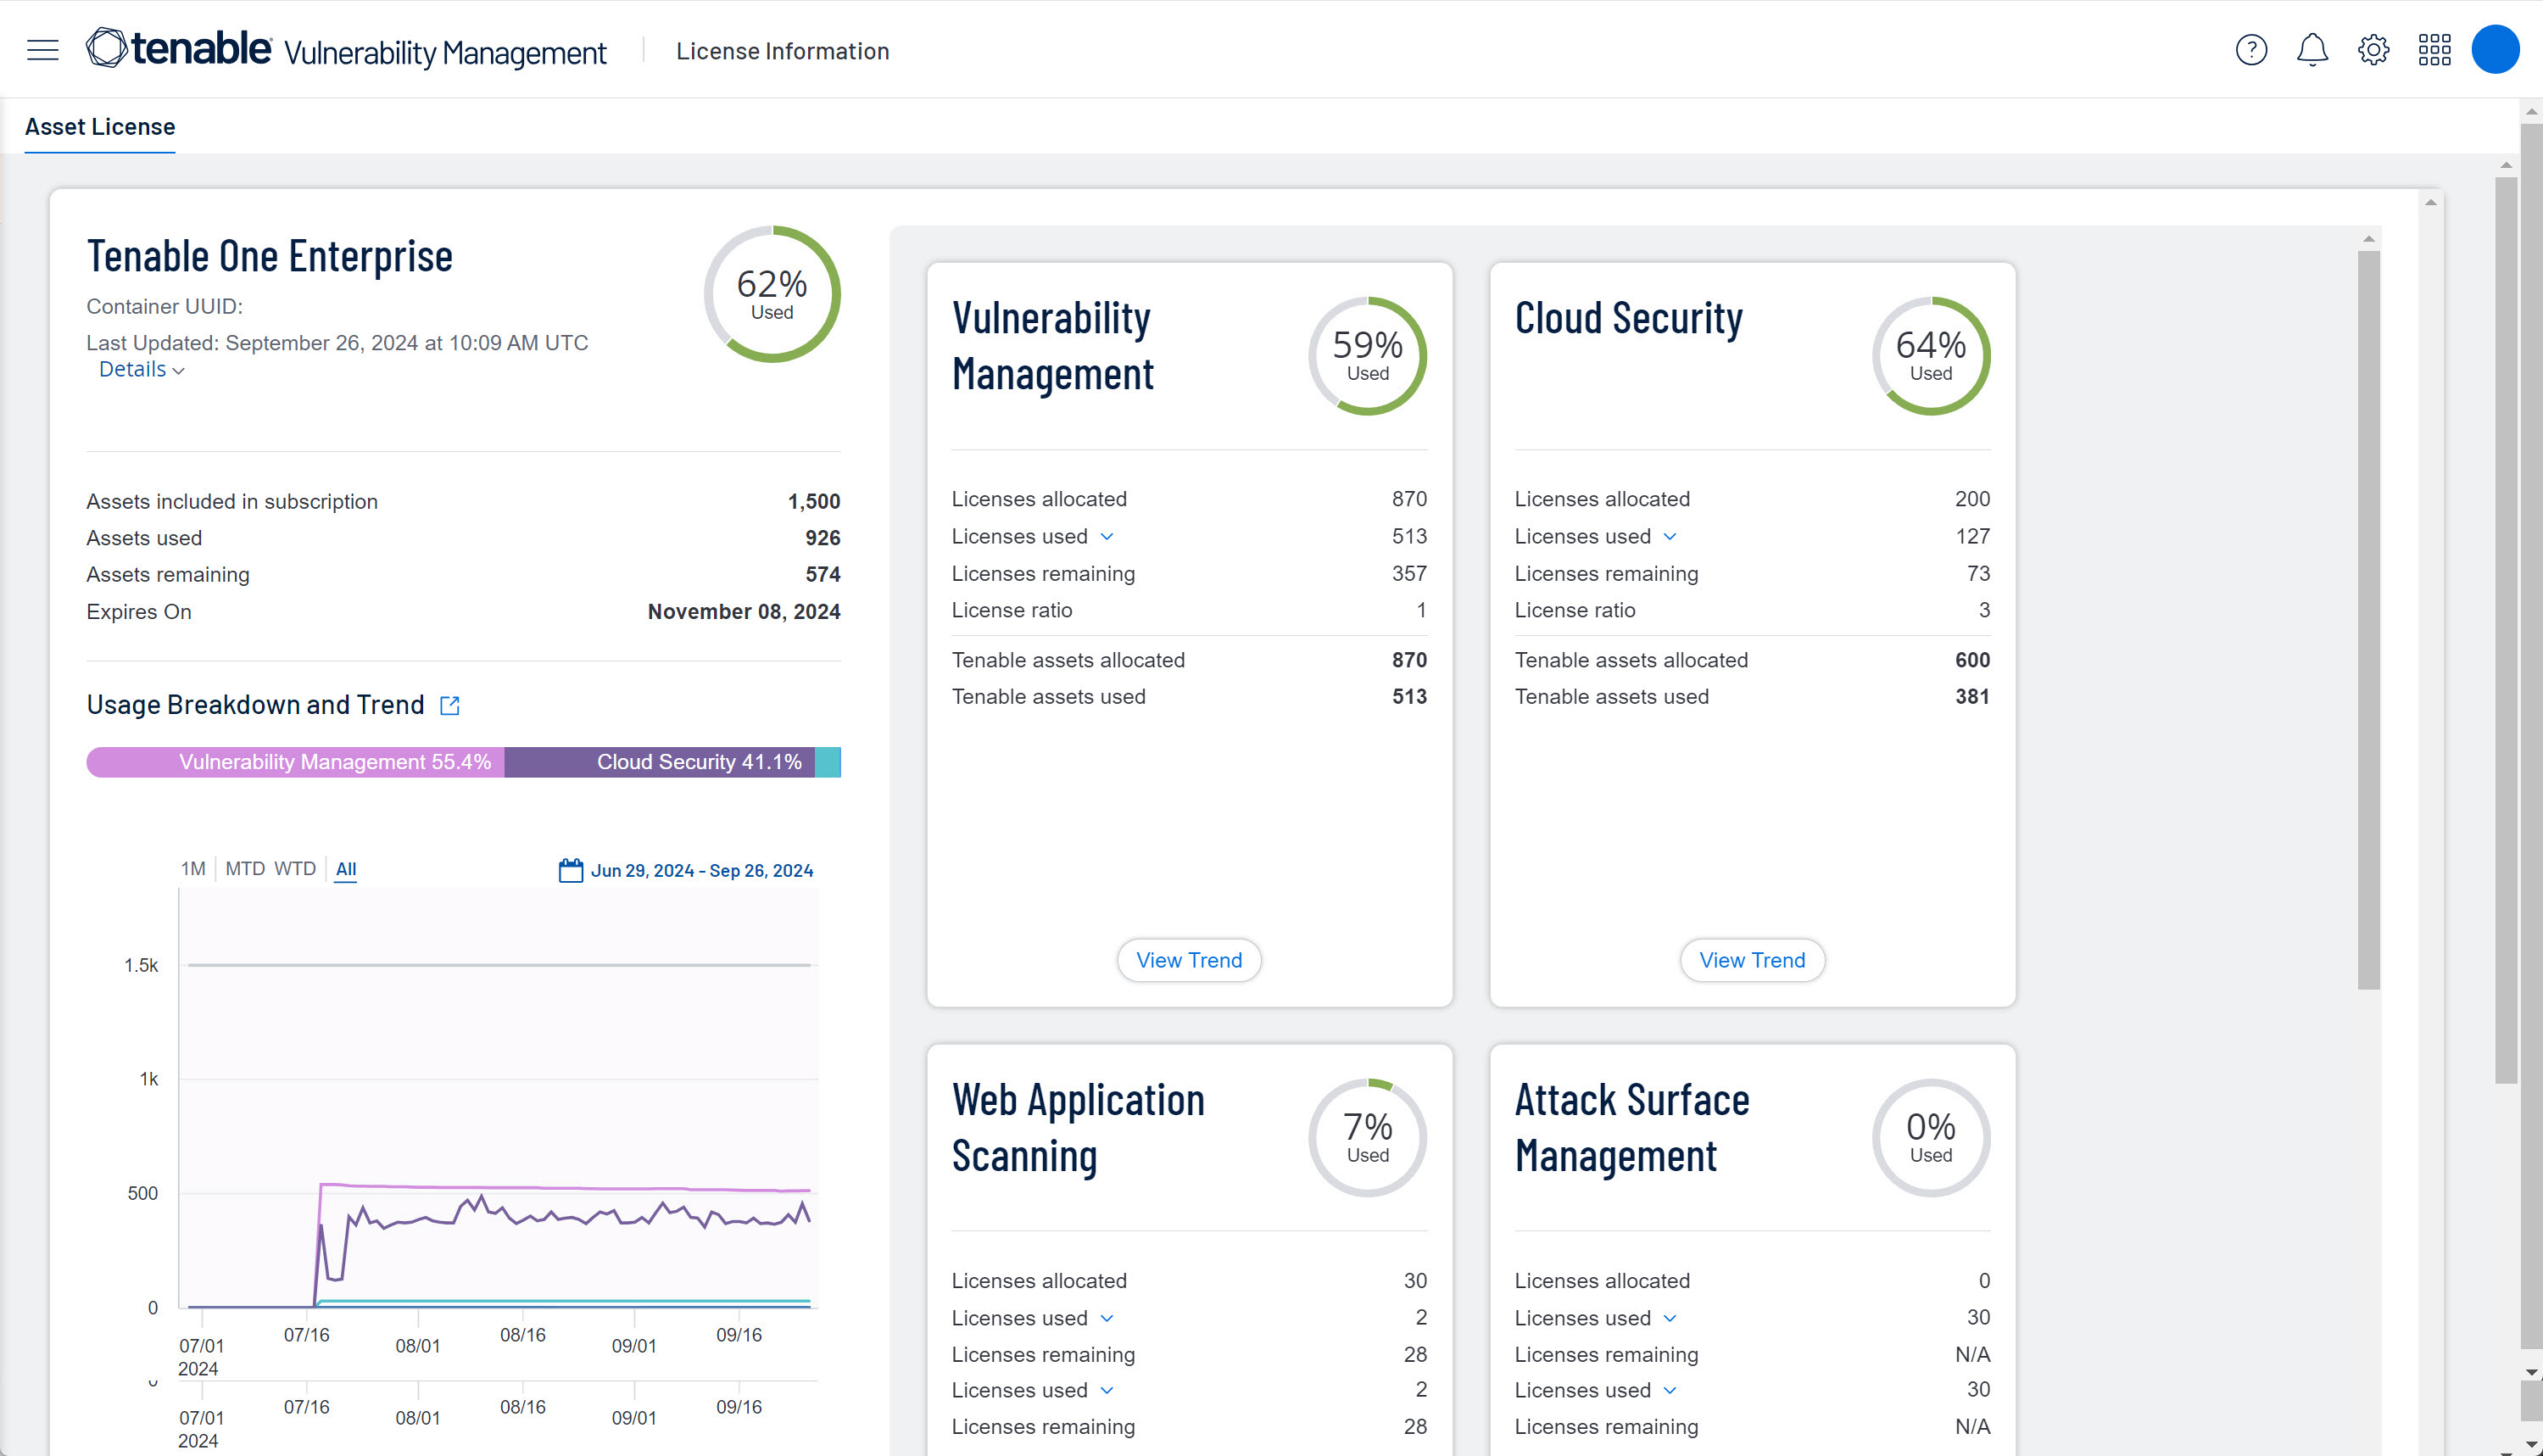
View information about your Tenable licenses in the Asset License tab, which appears by default when you open the License Information page. The Asset License tab shows license usage for products in the current Tenable container. Details appear in panels, separated by product.
If you have Tenable One:
-
To view its components, in the bottom-right corner, click Show More.
All Tenable One components and their licensing information appears.
The following information appears on the Asset License tab:
| Section | Description |
|---|---|
|
Product Panels This section contains a summary of all of your Tenable licenses and usage. |
|
|
Product summary |
In the top left corner, you can view the following:
This section also contains the following:
|
|
Usage Breakdown & Trend |
See visual breakdowns of your asset license usage:
|
|
Tenable One product panels The Tenable One product panels appear when you click Show More on the Tenable One panel. Each product panel contains an overview of the licenses allocated to each Tenable One product, and license usage for each product. |
|
|
Product summary |
At the top of the panel you can view the following:
|
|
Licenses allocated |
The total number of your Tenable asset licenses allocated to the product. |
|
Licenses used |
The total number of Tenable asset licenses used in that product. If you have Tenable One, this number is the total of all asset licenses used across all Tenable One components. Tip: The type of asset you license varies by product. To learn more, see Tenable One Components. |
|
Licenses remaining |
The number of Tenable asset licenses you have allocated to the product that remain unused. |
|
License ratio |
If any, the ratio against which the assets in your environment are multiplied to determine how many Tenable asset licenses you need to purchase. For example, if you have 1,000 assets to assign to Tenable Identity Exposure, you will need 500 Tenable asset licenses, since the ratio is 0.5. To learn more, see Licensing Tenable One. |
|
Tenable assets allocated |
The total number of Tenable asset licenses you have assigned to a product, accounting for any ratio. |
|
Tenable assets used |
The total number of Tenable asset licenses used by that product, accounting for any ratio. |
| View Trend |
View your asset license use over time in a line chart where the X-axis is the time period and the Y-axis is the number of asset licenses used. Filter the chart by time period. Below the chart, click a component to show or hide it. |
|
Asset Breakdown |
(Cloud Security and Third Party Connectors only) When you click Asset Breakdown, a list of resources and their asset counts appears.
|
Account Details
View your account details in the Account Details tab, which contains information about your organization and your Tenable products. It is always the same, regardless of which Tenable container you are using.
Required User Role: Administrator
The Account Details tab contains the following information:
|
Section |
Description |
|---|---|
|
Account Information |
View your account information:
|
|
Tenable One Licenses |
Under Active Product Subscriptions, view information about your Tenable One licenses, including version, your container's unique ID, your allocated assets, and your Tenable asset license's start and end dates. Also view a table with the following columns:
Tip: Next to a product, click the drop-down > to view information about your Tenable One components by Product Type, Percent Allocated, Assets Used, and Assets Allocated. |
|
Standalone Product Licenses |
Under Active Product Subscriptions view information about your standalone licenses. Note: On-premise products such as Tenable Agent or Tenable Cloud Security do not appear here. In a table, view the following:
|

