Network Map
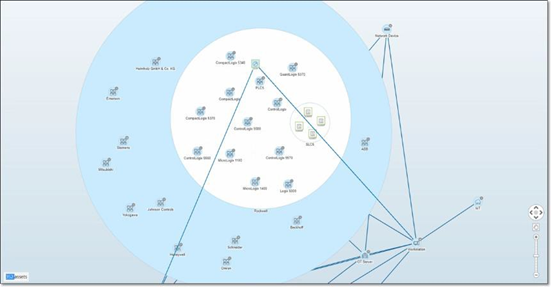
The Network Map screen offers a visual representation of the network assets and their connections over time, that Tenable One OT Exposure’s Network Detection capabilities discovered. Network Detection provides in-depth and real-time visibility into all activities over the operational network, focusing on control-plane engineering activities, such as firmware downloads or uploads, code updates and configuration changes, performed over proprietary, and vendor-specific protocols. Network Map shows the assets by groups of related assets or as individual assets.
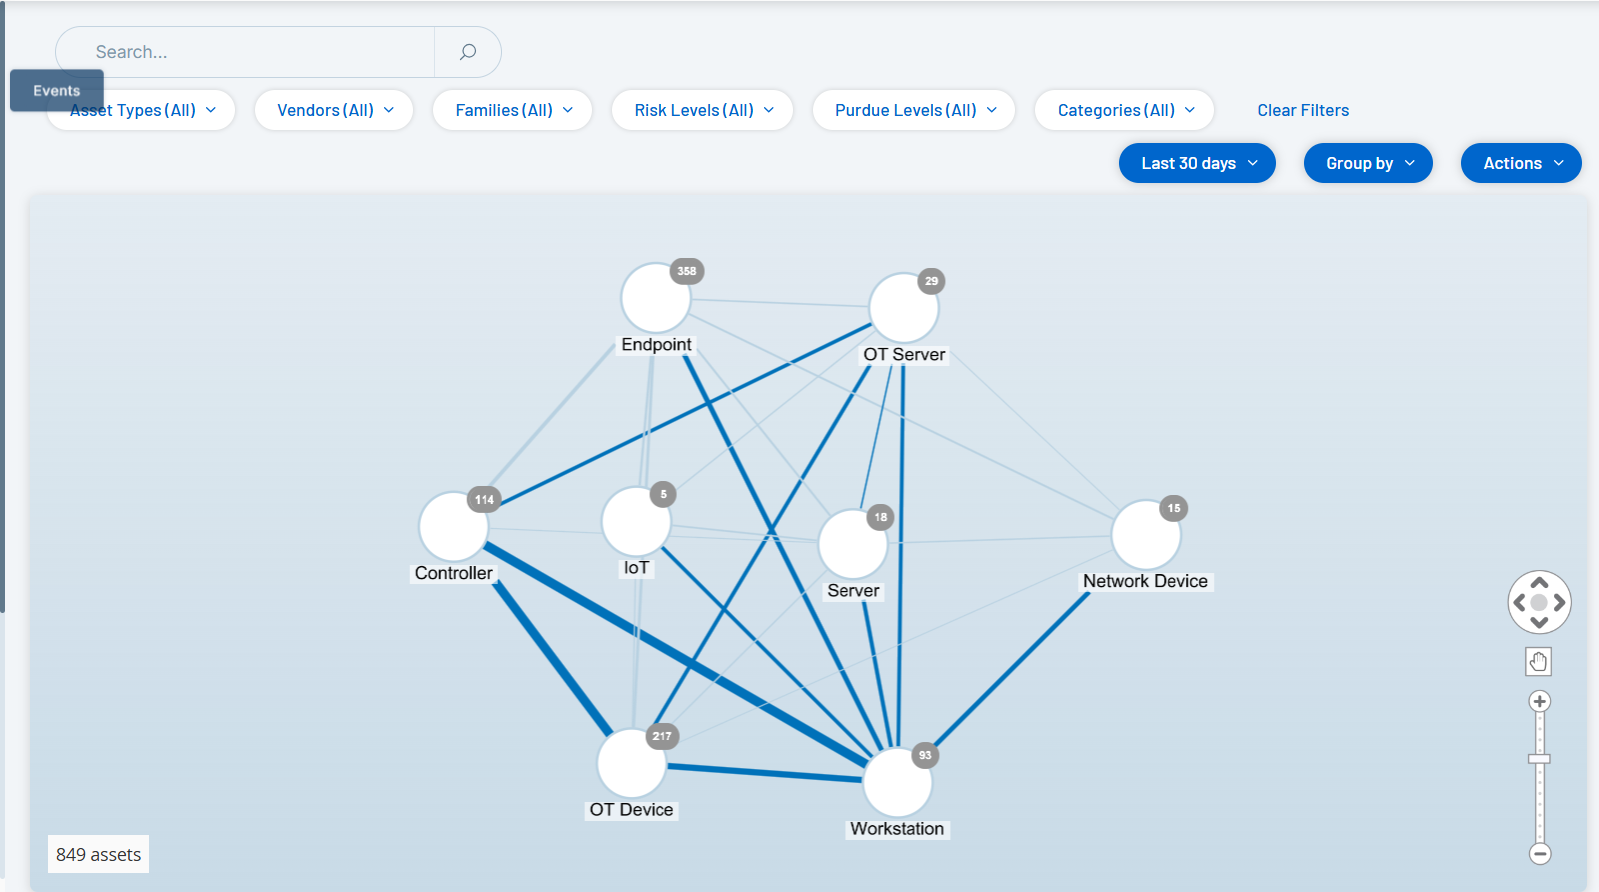
The Network Map shows all assets and connections that Tenable discovered during the specified timeframe.
The Network Map page shows the following details:
-
Search Box — Type a search text to search for assets in the display. The Network Map shows the search results by highlighting all groups that match the search text. You can drill down into each group to see the relevant assets.
-
Filters — Filter the map display by one or several of the specified categories: Asset Type, Vendors, Families, Risk Levels, and Purdue Levels. For an explanation of asset types, see Asset Types.
-
Time Frame — The Network Map shows assets and network connections detected during the specified timeframe. The default timeframe is set for Last 30 days. In the timeframe drop-down box, select a different timeframe.
-
Grouping — Specify the category used to group the assets in the display. The options are: Asset type, Purdue level, Risk level, or No grouping. The Collapse all groups option keeps the current grouping selection visible but collapses all other open groups.
-
Actions — You can select the following actions from the drop-down menu:
-
Set as baseline — Set the baseline used for detecting anomalous network activity, see Set a Network Baseline.
-
Auto arrange — Automatically optimize the map display for the entities currently being displayed.
-
-
Groups/Assets — An icon on the map represents each group of assets, with a distinct icon depicting each asset type. as described in Asset Types. For groups, the number at the top of the icon indicates the number of assets in that group. You can drill down to show separate icons for each sub-group until you get to the individual asset icons. For individual assets, the color of the frame around the asset indicates its risk level (red, yellow, green).
Note: You can drag the groups and assets and reposition them to get a better view of the assets and their connections. -
Connections — Each communication between groups of assets and/or individual assets, according to the degree of granularity currently displayed in the map. The thickness of the line indicates the volume of communication through that connection.
The network map uses color codes to differentiate IT and OT protocols.
-
A gray line indicates IT-only protocols (for example, DNS, HTTP, and FTP).
-
A blue line indicates the presence of OT protocols (for example, HTTP, MODBUS, CIP, and FTP).
-
-
Total Assets Displayed — Shows the number of assets detected in the network (and displayed in the map) based on the specified timeframe and asset filters. This number is shown relative to the total number of assets detected in your network.
-
Navigation Controls — You can adjust the display by zoom in and out and navigate to show the desired elements using either the onscreen controls or standard mouse controls.
Asset Groupings
The Network Map page can show assets grouped by various categories. It shows connections between groups of assets. You can click on an asset to drill-down to the elements in that group. You can also drill-down in multiple groups simultaneously. Tenable One OT Exposure offers multiple layers of embedded groups, so that drill-down gives you a more granular view of the included assets.
The following are the Groupings that you can apply to the main display and the drill-down options for that selection.
When the map displays groups by Asset Type (default), the drill-down hierarchy is as follows: Asset Type > Vendor > Family > Individual Asset.
When the Map displays groups by Risk Level or Purdue Level, it adds an additional level above the Asset Type grouping to give this hierarchy: Purdue Level/Risk Level > Asset Type > Vendor > Family > Individual Asset. A circle surrounds the included groups/assets, representing each level.
The following example shows how you can drill down to the display:
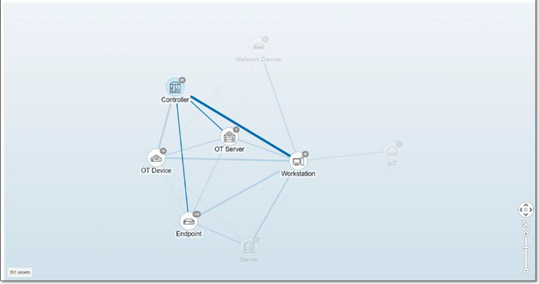
To drill down to an Asset Type Group:
-
By default, the Network Map screen opens with the assets grouped by Asset type.
-
Double-click on the group icon that you want to drill down into (for example, Controller).
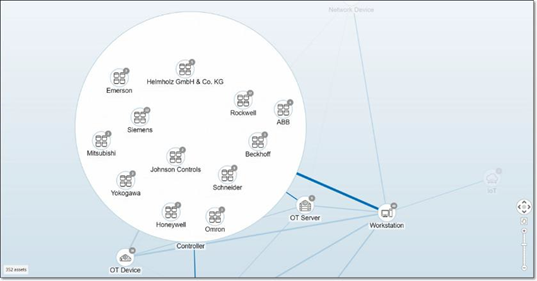
The group expands to display the Vendor groups within that group.
-
To drill down further, click a Vendor group (for example, Rockwell).
-
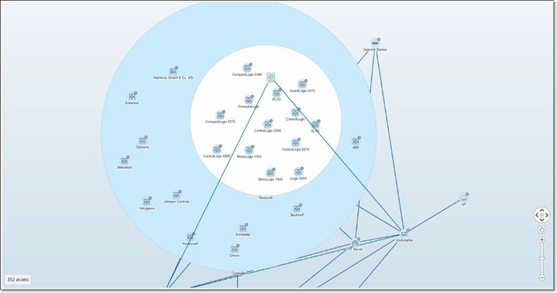
To drill down further, click a Family group (for example, SLC5).
The individual assets within that group appear.
-
You can now click a specific asset to see details for that asset and its connections, see Inventory.
To collapse the display:
-
Click on Group by.
-
Click Collapse all groups.
The display shows the top-level groups again.
To remove all grouping:
-
Click on the Group by button.
-
Select No grouping.
The map shows all single assets without any grouping.
Apply Filters to the Map Display
You can filter the map display by one or several of the specified categories: Asset Type, Vendors, Families, Risk Levels, Purdue Levels.
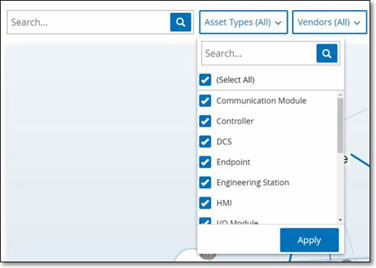
To apply filters to the map:
-
Click the required filter category.
-
Select or clear the check boxes for each element that you want to include or exclude from the display.
Note: By default, the filter includes all elements.
-
You can click the Select All check box to clear all the values and add the desired values.
-
You can perform a search in the filter search box to find a specific value in the filter window.
-
Repeat the process for each filter category, as needed.
-
Click Apply.
The map shows only the selected elements.
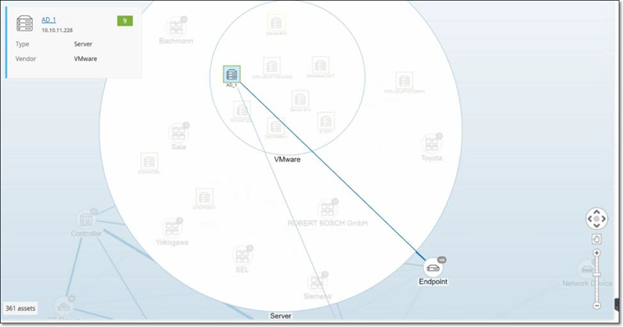
View Asset Details
You can click a specific asset to display basic information about the asset and its network activities, including the risk level, IP address, asset type, vendor, and family. The map displays connections from the selected asset to all of the other assets that communicate with it. You can then click the asset name link to go to the Asset Details screen for more details about the asset.
Set a Network Baseline
A Network Baseline is a map of all conversations that took place between assets in the network during a specified time period. The Network Baseline serves for Network Baseline Deviation Policies, which alert for anomalous conversations in the network, see Network Event Types.
Assets that did not interact during the Baseline sample trigger a Policy alert for each conversation (assuming it falls within the scope of the specified Policy conditions). To enable the creation of Network Baseline Deviation policies, you must first create an initial Network Baseline on the Network Map screen. You can update the Network Baseline anytime by setting a new Network Baseline.
To set a Network Baseline:
-
On the Network Map screen, select the time range of the conversations to include in the Network Baseline using the Time Frame Selection at the top of the screen.
The Network Map for the selected time frame appears.
-
In the upper-right corner, select Actions > Set as baseline.
Tenable One OT Exposure configures the new network baseline and applies the baseline to all Network Baseline Deviation Policies.