Dashboard
The Dashboard page within Tenable AI Exposure allows you to gain a comprehensive understanding of your AI usage and associated risks. The goal is to position you to take proactive measures by surfacing the most relevant Key Performance Indicators (KPIs) in a unified, holistic view.
On the Dashboard page, you can get an at-a-glimpse idea of:
-
Your key drivers:
-
What AI usage, threats, and exposure are driving your findings, and by how much?
-
Where are the majority of your findings coming from?
-
How many risks can Tenable AI Exposure automatically prevent?
-
-
Your findings:
-
How many open findings do you have, and how severe are they?
-
What topics are being discussed using AI?
-
-
Your users:
-
Who are your top risky users?
-
How many messages are these users sending weekly? What applications are they using to send these messages?
-
To access the Dashboard page:
-
Log in to Tenable AI Exposure.
By default, the Dashboard page appears.
The Dashboard page includes the following sections:
Graph Overview
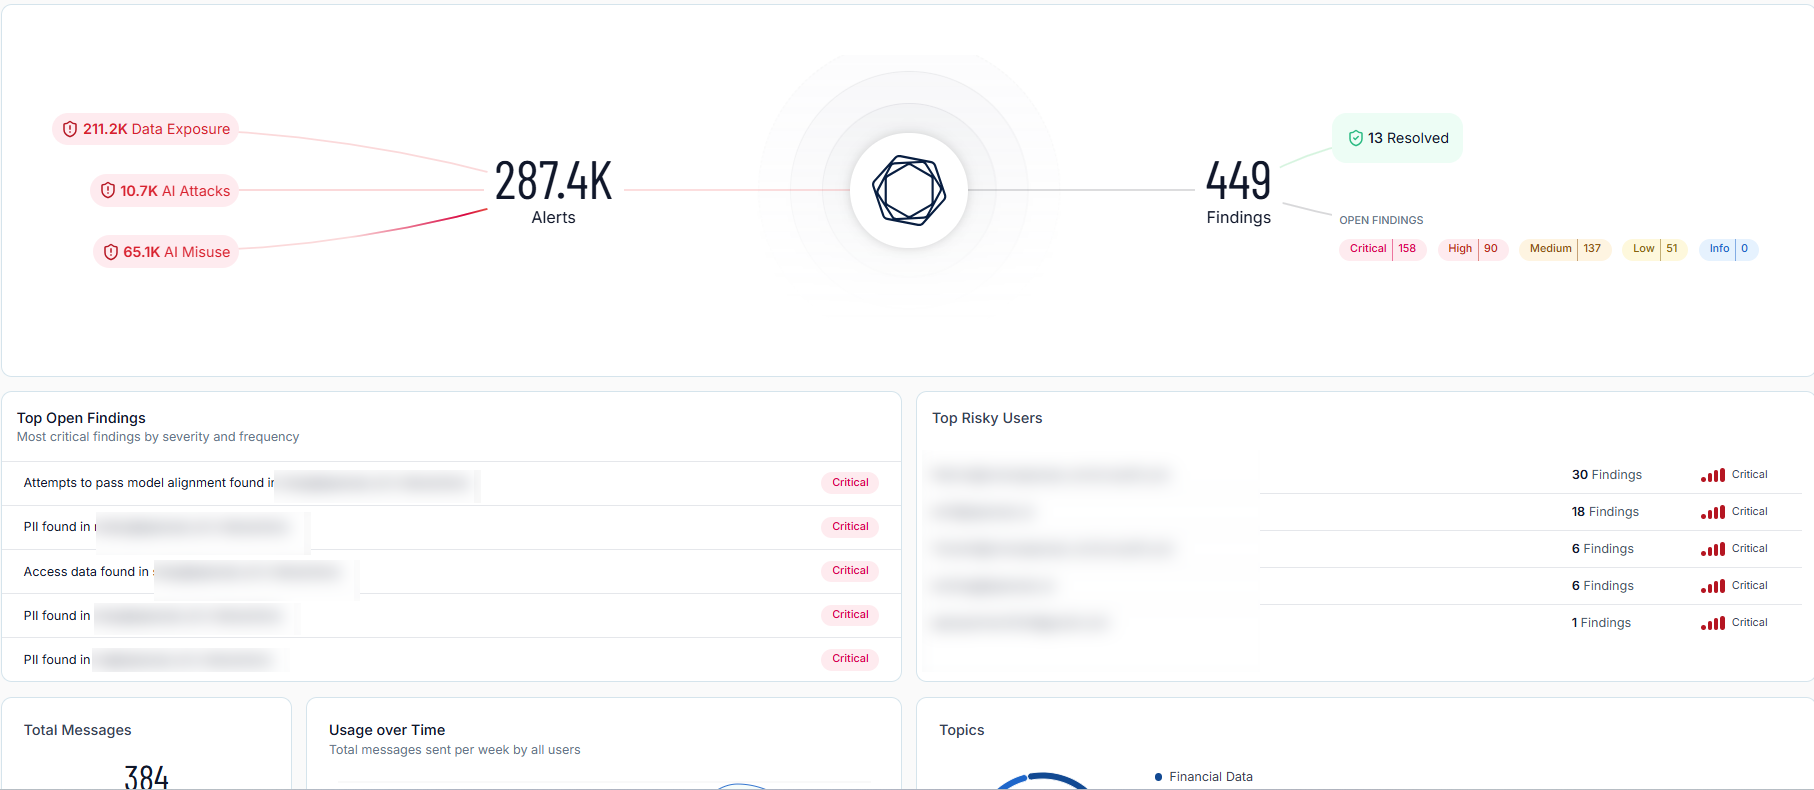
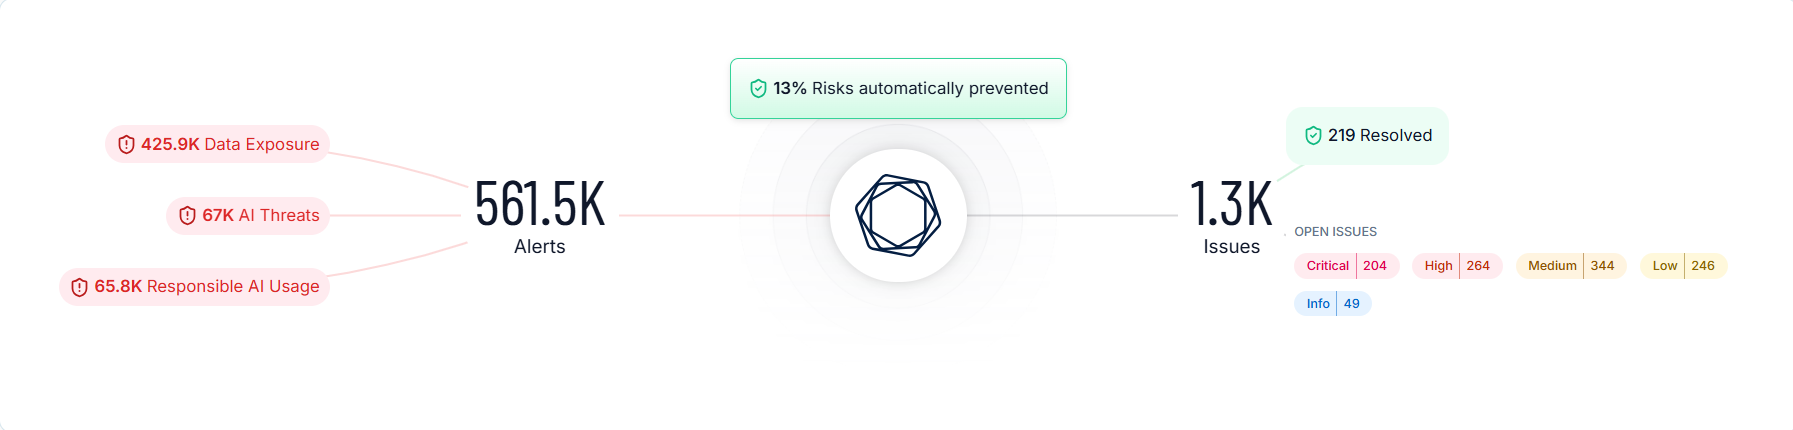
At the top of the Dashboard page, you can view a graphical representation of your incoming AI risks and how those risks translate into findings within your environment.
-
The left side of the graph highlights the different types of AI exposure, usage, and threats that become alerts.
-
The middle of the graph shows the percentage of AI risks that have been automatically prevented by Tenable AI Exposure based on user-configured policies and exclusions.
Tip: For more information, see Policies. -
The right side of the graph displays the number of currently open findings and breaks down the number of findings into categories based on their severity. Additionally, you can view the number of findings that have been resolved using Tenable AI Exposure.
Top Open Findings
The Top Open Findings section highlights the most critical findings present in your environment and organizes them by severity and frequency.
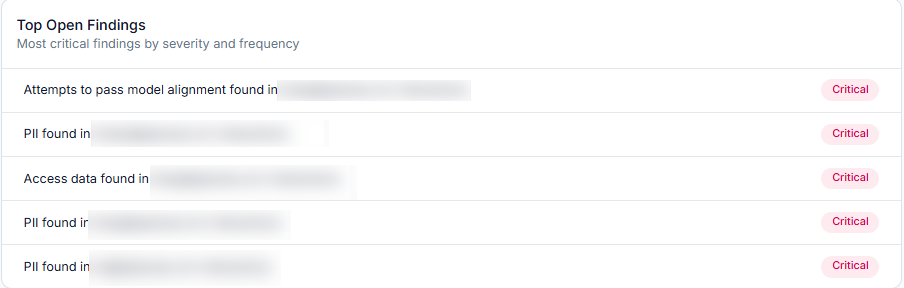
Here, you can view the following information about these findings:
-
A brief description of the issue.
-
Color coded severity categories that indicate how critical the open issue is, for example, Critical or Medium.
Tip: For more information about these severity categories, see Finding and Alert Severity.
Top Risky Users
The Top Risky Users section highlights the Tenable AI Exposure users in your container that are responsible for the highest number of findings.
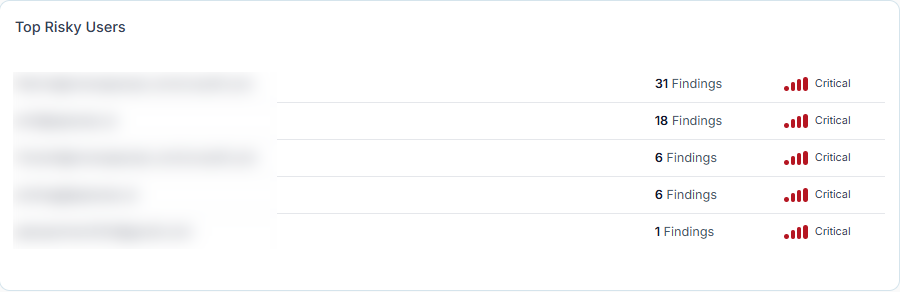
Here, you can view the following information about these users:
-
The user's name.
-
The number of findings for which the user is responsible.
-
Color coded severity categories that indicate how critical the open issue is, for example, Critical or Medium.
Tip: For more information about these severity categories, see User Risk.
Total Messages
The Total Messages section shows the number of messages sent between your Tenable AI Exposure users and AI platforms.
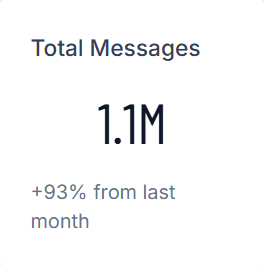
Here, you can view the following information about these messages:
-
The total number of messages.
-
The percentage by which the total number of messages has increased in the last month.
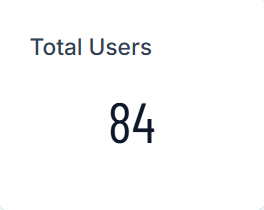
Total Users
The Total Users section shows the total number of Tenable AI Exposure users within your container.
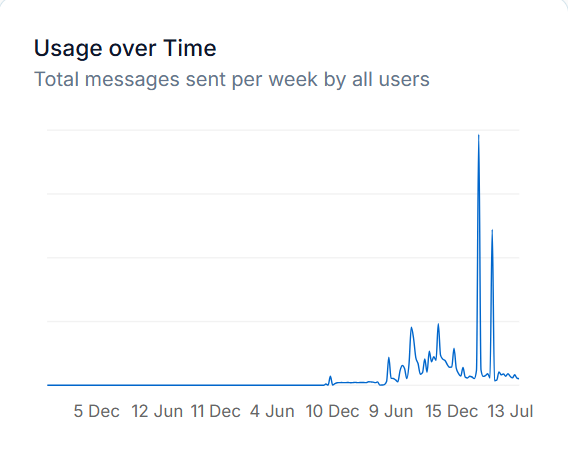
Usage Over Time
The Usage Over Time section includes a graphical representation of the total messages sent per week by all users within your Tenable AI Exposure container.
Topics
The Topics section includes a graphical representation of the top 5 topics discussed within your Tenable AI Exposure user's messages to AI applications.

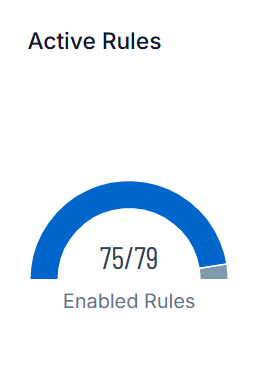
Active Rules
The Active Rules section displays the number of active rules as compared to the total number of enabled rules within your Tenable AI Exposure container.
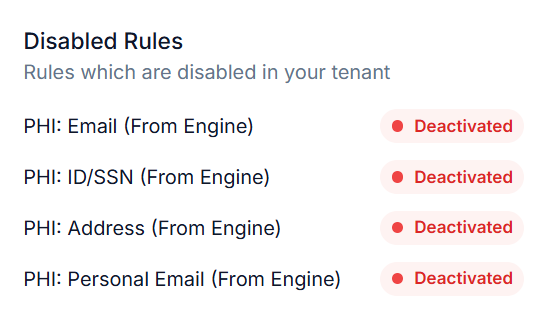
Disabled Rules
The Disabled Rules section displays most recently disabled rules within your Tenable AI Exposure container.