Risk Assessment
Several sections within the NIS 2 may be best suited to fall into the Risk Assessment category. Those include:
-
Article 21(2) (a): Risk Analysis and Information System Security: Cyber Risk-Based Approach
-
Article 21(2) (c): Business Continuity: Business Continuity Process and Technology
Periodic risk assessment is the primary tool for engineers and security analysts to manage risks by maintaining good cyber hygiene, reducing operational downtime and mitigating the potential impact of threats.
Risk = Probability x Impact
Probability refers to the likelihood that an event occurs. Impact refers to the consequences or severity if the risk event actually does occur. This formula is foundational in assessing and prioritising risks within an organisation. Assessing the probability involves evaluating factors such as historical data and expert judgement, along with potential causes that could lead to the occurrence of a risk event. The result of the assessment is often a qualitative rating, such as Low, Medium, or High. Impact can only be determined by understanding the potential consequences of an event on various organisational aspects, such as finances, operations, reputation, safety, and legal compliance. Impact is quantified in terms of monetary value, or time.
Based on impact, two options are available, risk acceptance and risk mitigation. If the organisational risk is low, perhaps the risk can be accepted. Tenable products allow risk acceptance as an option. Accept risk rules can be created that allow for the acceptance of vulnerabilities without actually changing the severity level of the plugin. Vulnerabilities that have been accepted are still identified by a scan, but hidden in the results of the scan. For risks that require remediation, a risk assessment process should be followed.
A risk assessment is a systematic process of identifying and evaluating identified risks that may impact organisations operations or assets. There are five main steps to performing a risk assessment: Identification of the hazards, Assessing the risks, Controlling the risks, Recording the findings, and Reviewing the controls. Once the vulnerabilities have been identified, the organisation needs to assess the identified risks, and prioritise the remediation efforts. Vulnerabilities should be assessed on their potential impact, and strategies should be developed to mitigate or manage these risks effectively.
Risk assessments are critical for helping organisations make informed decisions, prioritising resources, and proactively managing risks, while minimising potential negative impacts. While the vulnerability management section deals specifically with identification aspects, this section provides guidance to organisations on how to assess and prioritise risks which have been identified within the environment.
Prioritising Risk with ACR, AES, and VPR
When dealing directly with assets, Tenable assists organisations prioritise risk by assigning an Asset Criticality Rating (ACR), and Asset Exposure Score (AES). When dealing with vulnerabilities a Vulnerability Priority Rating (VPR) is assigned. The ACR establishes the priority of each asset based on indicators of business value and criticality. ACR is based on several key metrics such as business purpose, asset type, location, connectivity, capabilities, and third-party data. ACRs range from 0 to 10. Assets with a low ACR are not considered business critical. Assets with a high ACR are considered to be the organisation’s most critical and carry the greater business impact if compromised.
| Critical | High | Medium | Low |
|---|---|---|---|
| 9-10 | 7-8 | 4-6 | 1-3 |
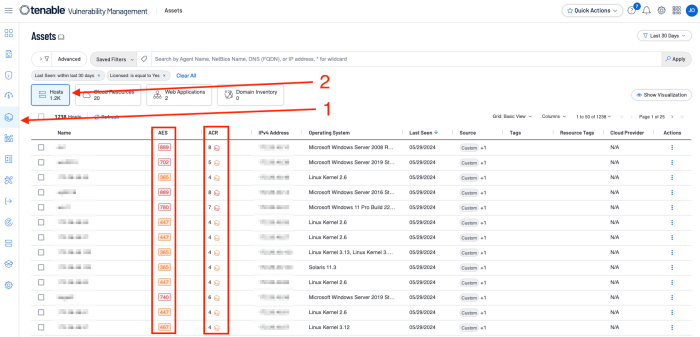
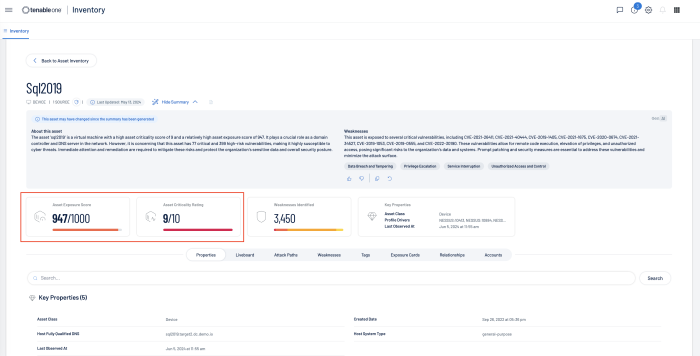
Asset Exposure Score (AES) is also calculated for licenced assets. Asset Inventory calculates a dynamic AES for each asset on your network to represent the asset's relative exposure as an integer between 0 and 1000. The AES is a calculated integer using both ACR and the asset level VPR. A higher AES indicates higher exposure, as the following chart converts the AES number to a severity rating.
| High | Medium | Low |
|---|---|---|
| 650-1000 | 350-649 | 0-349 |
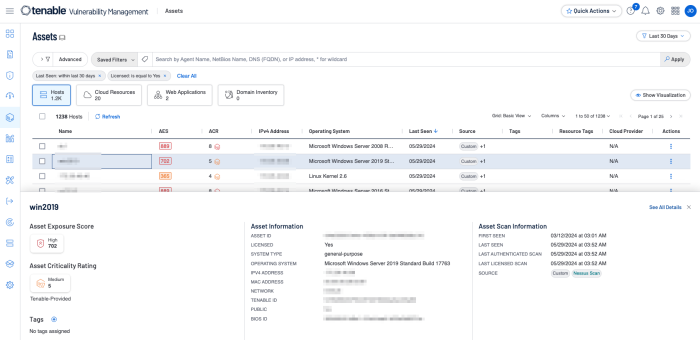
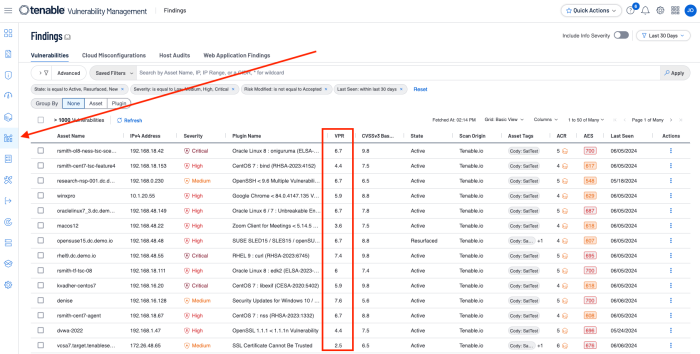
To view the ACR or AES information for any asset within Tenable Vulnerability Management, Navigate to the Assets page.
Select an asset to view the asset details.
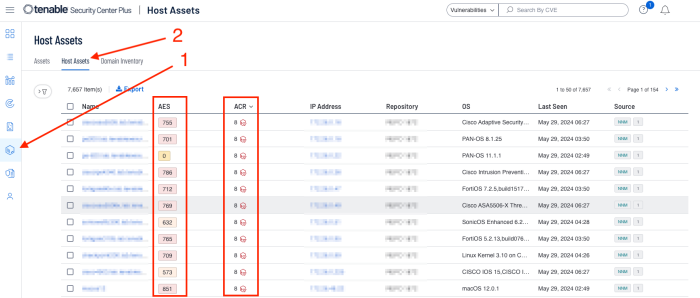
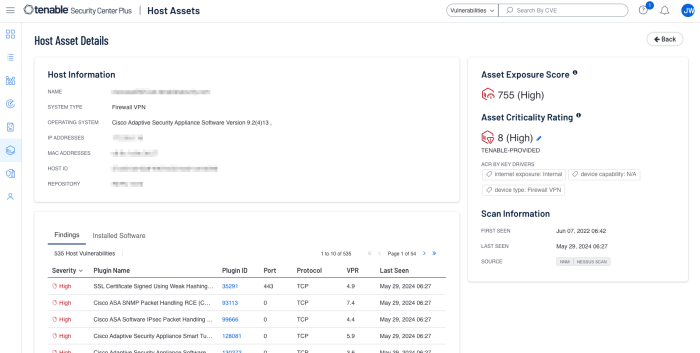
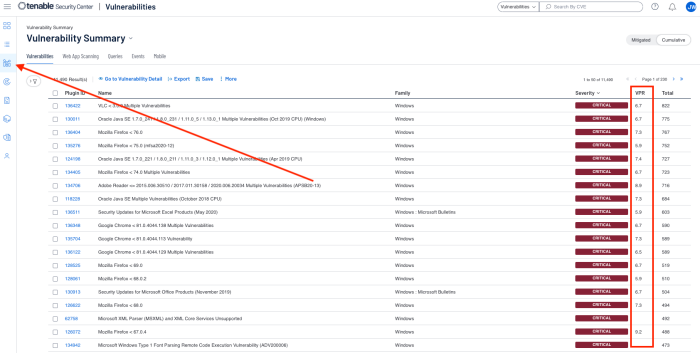
To view the ACR or AES information for assets within Tenable Security Center the process is similar. Navigate to the Assets page, then select Host Assets. A list of assets will be displayed along with their associated ACR and AES scores.
Select an asset to view the asset details.
Within Tenable One, AES and ACR can be best viewed from the See Details link on the Assets page.
AES and ACR scores are attributed to assets. A Vulnerability Priority Rating (VPR) is associated with the vulnerabilities themselves. If the organisation is familiar with the Common Vulnerability Scoring System (CVSS), the VPR score is similar to the CVSSv3 impact subscore. VPR is a unique vulnerability severity rating in that the rating can change over time. Tenable updates a vulnerability's VPR score daily to reflect the current threat landscape. VPR ranges are values from 0.1-10, with the highest value representing a higher likelihood of exploitation. VPR severity ratings cannot be edited or customised. VPR scores are derived from seven key drivers:
-
Age of Vulnerability: - The number of days since the National Vulnerability Database (NVD) published the vulnerability.
-
CVSSv3 Impact Score - The NVD-provided CVSSv3 impact score for the vulnerability. If the NVD did not provide a score, Tenable Vulnerability Management displays a Tenable-predicted score.
-
Exploit Code Maturity - The relative maturity of a possible exploit for the vulnerability based on the existence, sophistication, and prevalence of exploit intelligence from internal and external sources (for example, Reversinglabs, Exploited, Metasploit, etc.). The possible values (High, Functional, PoC, or Unproven) parallel the CVSS Exploit Code Maturity categories.
-
Product Coverage - The relative number of unique products affected by the vulnerability: Low, Medium, High, or Very High.
-
Threat Sources - A list of all sources (for example, social media channels, the dark web, etc.) where threat events related to this vulnerability occurred. If the system did not observe a related threat event in the past 28 days, the system displays No recorded events.
-
Threat Intensity - The relative intensity based on the number and frequency of recently observed threat events related to this vulnerability: Very Low, Low, Medium, High, or Very High.
-
Threat Recency - The number of days (0-180) since a threat event occurred for the vulnerability.
VPR enhances traditional vulnerability ratings such as CVSS and Severity. The threat component reflects both recent and potential future threat activity against a vulnerability. Some examples of threat sources that influence VPR are public proof-of-concept (PoC) research, reports of exploitation on social media, emergence of exploit code in exploit kits and frameworks, references to exploitation on the dark web and hacker forums, and detection of malware hashes in the wild. Such threat intelligence is key in prioritising those vulnerabilities that pose the most risk to an organisation.
From within Tenable Security Center, VPR scores can be viewed from the Analysis tab.
From within Tenable Vulnerability Management, VPR scores can be viewed from the findings tab.
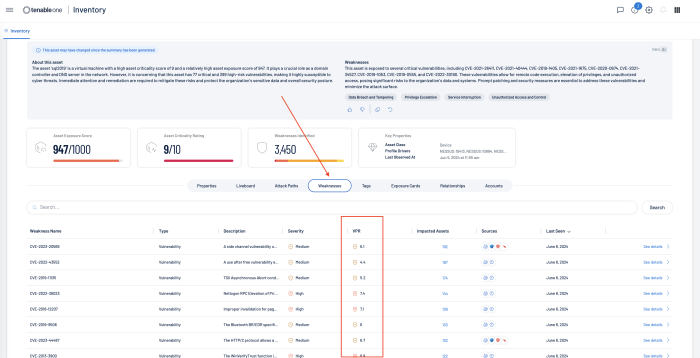
Tenable One VPR scores can be best viewed from the See Details link on the Assets page, and then by selecting Weakness.
Now that we have discussed AES, ACR, and VPR, along with their benefits, we can further enhance risk management with the Cyber Exposure Score (CES) The building blocks for the CES in the Tenable One Exposure Management Platform are similar to those used for years in Tenable products (for example, Tenable Vulnerability Management, Tenable Lumin). These mechanisms have to date only been used for vulnerability management data. Tenable One expands these concepts into new realms of the attack surface: Web Applications (Tenable Web App Scanning), Cloud Resources (Tenable Cloud Security), Tenable OT Security, and Identity (Tenable Identity Exposure).
The following concepts are foundational to the scoring utilised in Tenable One:
Vulnerability Priority Rating (VPR): The severity and exploitability of a given vulnerability. A vulnerability’s VPR is expressed as a number from 0.1 to 10, with higher values corresponding to a higher likelihood of the vulnerability leading to a compromise and a higher impact on the asset. This score is found in Tenable Vulnerability Management.
Asset Criticality Rating (ACR): Rates the criticality of an asset to the organisation. An asset’s ACR is expressed as an integer from 1 to 10, with higher values corresponding to the asset being more critical to the business. This score is utilised in Tenable Lumin.
Asset Exposure Score (AES): A combination of the VPR and ACR of a given asset.
Prioritising Risk with Lumin Exposure View and Attack Path Analysis
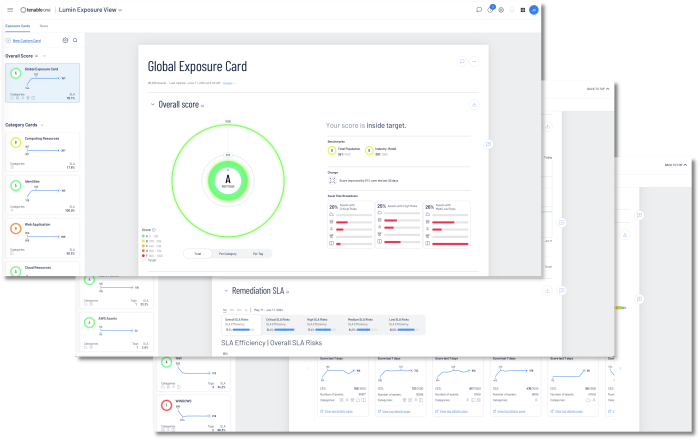
Tenable Lumin Exposure View provides at-a-glance insight into all weaknesses and exposures. It combines data sources from all Tenable solutions, including IT assets, identity systems, cloud resources, web applications, and your OT infrastructure.
One of the hardest tasks to accomplish is proper risk prioritisation and communication of risks and vulnerabilities. Lumin Exposure View provides the exposure cards, which allows easy identification of problem areas so resources can be applied properly where needed. An exposure card represents incoming data from configured tags and data sources. This data is aggregated and normalised to provide a visual representation of your CES and other metrics. Note: Exposure cards can be customised or Tenable provided cards can be used.
The CES is presented under the letter grade, in the form of a number such as 167/1000. The CES score is a value from 0-1000, with higher values indicating higher exposure and higher risk.
Follow this link for more information on Lumin Exposure View.
Tenable Attack Path Analysis gives security teams the ability to take the attackers perspective with context across the organisation. Analysts can easily browse an organisation's environment to understand relationships and exposures. This allows a physical view into the same combination of exposures that attackers can see, which lead to unwanted lateral movement into critical assets. Additionally, organisations can remove the guesswork of where to start first, identify and prioritise attack paths based on unique context, and stay up to date with common adversary Tactics, Techniques, and Procedures (TTPs) from MITRE ATT&CK.
To achieve the best results a few criteria must be met:
-
The percentage of authenticated Tenable Vulnerability Management scans and Web Application scans must be at least 40%.
-
Tenable Identity Exposure must be configured
-
A Tenable Cloud Security resource must have been performed.
For more information, see Get Started with Attack Path Analysis
Attack Path Analysis anticipates and prioritises the most critical attack paths within the environment by leveraging advanced threat intelligence and analytics. By leveraging the power of artificial intelligence, Attack Path Analysis delivers guidance based uniquely on the organisation's environment. By maintaining the relationship between assets, vulnerabilities, and potential attack paths, organisations can stay ahead of threats, and respond quickly to threats using step-by-step recommendations that are provided.
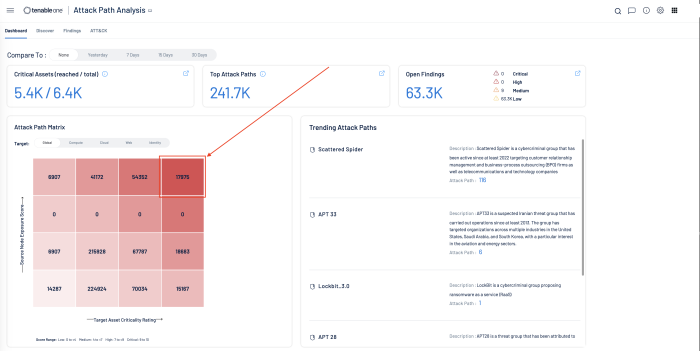
From the dashboard in Attack Path Analysis, selecting a cell (in this case the cell in the upper right reflects the most critical, combined highest exposure score and asset criticality rating), takes the user to the Discover page.
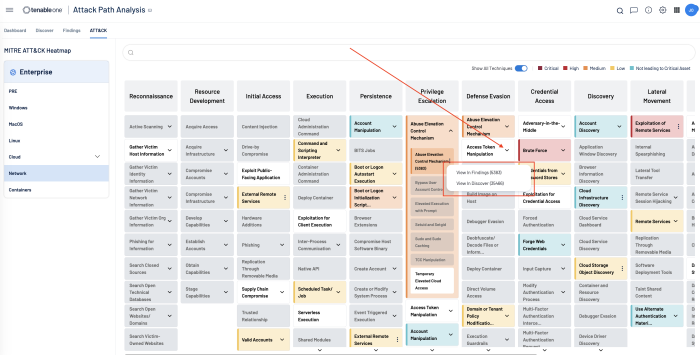
Selecting the ATT&CK page displays the MITRE Att&ck Heatmap. The heatmap provides a holistic view of the organisation's data based on the enterprise tactics and techniques from MITRE Att&ck. The data is presented in a table format which allows organisations to quickly prioritise and remediate critical vulnerabilities that are the most relevant to your organisation.
Table cells are colour-coded to indicate:
-
Grey - Tenable does not currently support these techniques
-
White - Tenable supports and detects these techniques, however they are not relevant to your organisation.
-
All other colours are based on severity:
Clicking the item displays options which can lead you back to the Findings or Discover page to view possible attack paths for the selected technique or sub-technique.
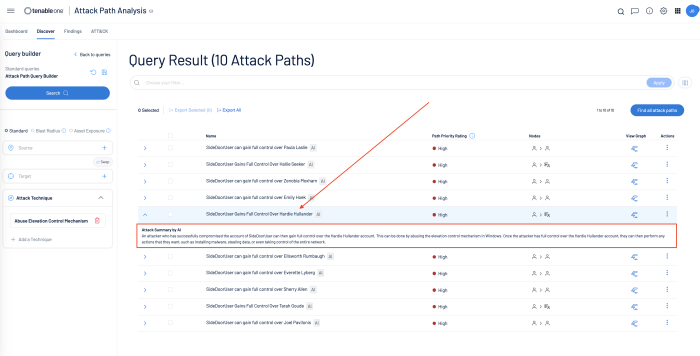
On the Discover page, clicking on one of the displayed attack paths display an attack summary explaining the attack path.
For a complete workflow example using Tenable Lumin Exposure View and Attack Patch Analysis to prioritise risks, see this example workflow link.
For more information related to Attack Path Analysis, see this link.
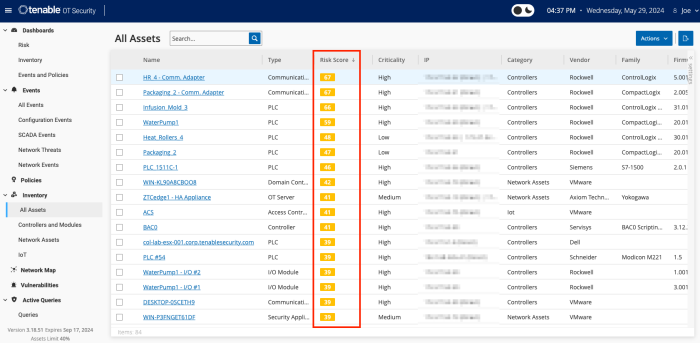
Tenable OT Security applies sophisticated algorithms to assess the degree of risk posed to each asset on the network. A Risk Score (from 0 to 100) is given for each Asset in the network. The Risk score is based on the following factors:
-
Events — Events in the network that affected the device (weighted based on Event severity and how recently the Event occurred). Note: Events are weighted according to currency, so that more recent Events have a greater impact on the Risk score than older Events.
-
Vulnerabilities — CVEs that affect assets in your network, as well as other threats identified in your network (for example, obsolete operating systems, usage of vulnerable protocols, vulnerable open ports, and so on.). In the OT Security, these are detected as plugin hits on your assets.
-
Asset Criticality — A measure of the importance of the device to the proper functioning of the system.
Note: For PLCs that are connected to a backplane, the Risk score of other modules that share the backplane affect the PLC’s Risk score.
The Risk Score can be viewed in several ways.
-
All three dashboards (Risk, Inventory, Events, and Policies)
-
All four inventory dashboards (All Assets, Controllers and Modules, Network Assets, IoT)
The Risk Assessment widget for Tenable OT, located on the compliance dashboard provides organisations with an updated and dynamic overview of at-risk assets by their criticality. Displaying assets by criticality assists organisations in prioritising and managing risks related to the OT/IoT environment. Key items displayed are assets with High, Medium, Low vulnerabilities and assets at high risk.
The External Exposure Risk widget also for Tenable OT, located on the compliance dashboard identifies external connections to the Industrial Control Systems (ICS) networks. This widget assists organisations meet compliance within supply chain security. As more vendors (both ICS equipment and machine builders) are using hybrid models. These hybrid models may reside in or out of cloud environments. This widget assists organisations identify, evaluate, and mitigate OT network, and IoT assets from unexpected external communication.
The following cross-reference information is provided to derive a more comprehensive and effective approach to managing information security requirements. NIS 2 Article 21(2) (a) references security in Risk Analysis and Information System Security.
Security domains define how information is classified, categorised, or administered. The following Security Domains, Sub-Domains, and Measures are related to NIS 2 Article 21(2) (a), and can assist organisations already using other standards and frameworks to comply with NIS 2.
SECURITY DOMAIN: Defence
SECURITY SUB-DOMAIN: Detection
SECURITY MEASURE: Detection
In an effort to foster higher consistency and reliability across multiple frameworks and the NIS 2, Article 21(2) (a) can be associated with the ISO 27001, NIST CSF, and ISA/IEC 62443 utilising the following cross-references for risk analysis. The following cross-references cover the processes and procedures related to Risk Analysis, Defense, and Detection.
CROSS REFERENCES:
The ISO 27001 references sections within Performance Evaluation, specifically the following sections:
-
ISO 27001(9.1, A.12.2, A.12.4, A.12.6.1, A.15.2.1)
The NIST CSF references the following sections within Detect, and Protect.
-
NIST CSF (PR.DS -6, 8, DE.AE -1,5, DE.CM -1, 2, 3, 4, 5, 6 7, DE.DP – 1, 2, 3, PR.PT -1)
The ISA/IEC 62443 references the following sections within Policies and Procedures, Systems, Zone Boundary Protection, Application Partitioning, Audit Logs, and Continuous Monitoring.
-
ISA/IEC 62443 (SR 2.8, SR 2.9, SR 2.10, SR 2.11, SR 2.12, SR 3.1, SR 3.3, SR 3.4, SR 3.8, SR 3.9, SR 5.1, SR 5.2, SR 5.4, SR 6.1, SR 6.2)
Additionally, the following cross-references are also related to Security Risk Analysis and should be considered as a reference within governance.
SECURITY DOMAIN: Governance and Ecosystem
SECURITY SUB-DOMAIN: Information System Security Governance & Risk Management
SECURITY MEASURE: Information system security risk analysis
In an effort to foster higher consistency and reliability across multiple frameworks and the NIS 2, Article REPLACE can be associated with the ISO 27001, NIST CSF, and ISA/IEC 62443 utilising the following cross-references for vulnerability handling and disclosure. The following cross-references cover the processes and procedures related to Risk Analysis and Governance and Ecosystem.
CROSS REFERENCES:
The ISO 27001 references sections within Planning, Operation, Performance Evaluation, and Improvement, specifically the following sections:
-
ISO 27001 (6, 8, 9.3,10, A.8.1.1, A.12.6.1, A.18.2.1)
The NIST CSF references the following sections within Identify, Respond, Detect, Recover, and Protect.
-
NIST CSF (ID.GV -4, ID.RA-1, 3, 4, 5, 6, ID.RM-1, 2, 3, RS.IM -1, 2, ID.SC -1, 2, PR.IP 12, RC.IM -1, 2, ID.AM -1, 2, 4, 5, DE.CM -8, RS.MI -3, RS.AN -5)
The ISA/IEC 62443 references the following sections within the Control Systems Component Inventory.
-
ISA/IEC 62443 (SR 7.8)
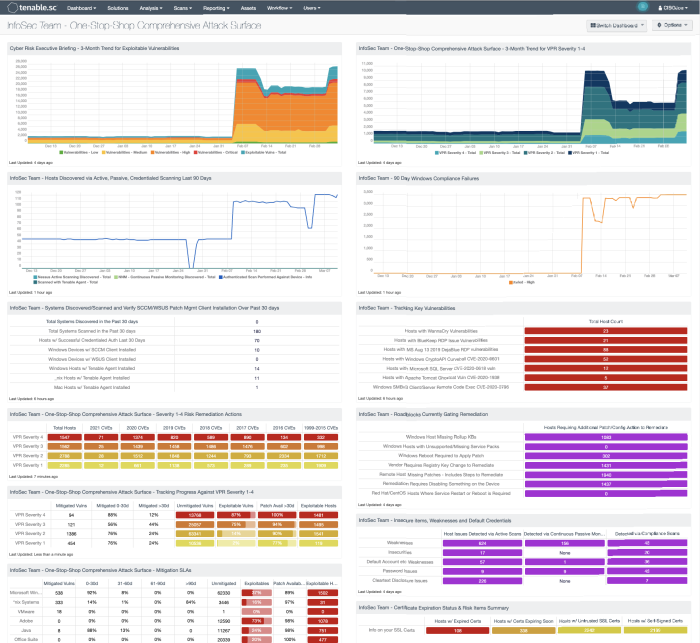
Organisations often have teams that focus on the detailed information relevant to the teams' assets; or operational focus areas, such as Windows, Linux, databases, or network infrastructure. The InfoSec Team – One-Stop Shop Comprehensive Attack Surface dashboard, shown in the following image, contains components that do not require specific asset list filters to be applied before use. The following dashboards provide a unique risk perspective to organisations across their entire environment, enabling quick and easy vulnerability prioritisation.
The Cyber Security Framework (CSF) category ID.RA (Risk Assessment) provides guidance to organisations on cyber risk and helps to define recommended actions for the security operations team. The ID.RA-1 category states requirements for the National Institute of Standards and Technology (NIST) 800-53 control CA-8 Penetration Testing. The control states 'Penetration testing is a specialised type of assessment conducted on information systems or individual system components to identify vulnerabilities that could be exploited by adversaries.' Some security teams leverage exploitation frameworks such as Core Impact, Canvas, or others to help with this control. Tenable Vulnerability Management identifies which vulnerabilities are exploitable by different frameworks. Exploit frameworks do not always have the same exploits, and, while there may be some overlap, a correlated view of exploits in the environment from multiple frameworks helps organisations understand which exploit frameworks pose the greatest threat.
For Tenable Vulnerability Management, the Pen Testing Team: One-Stop-Shop dashboard provides security operations teams a centralised view of common vulnerabilities and exploit frameworks present in the organisation’s environment.
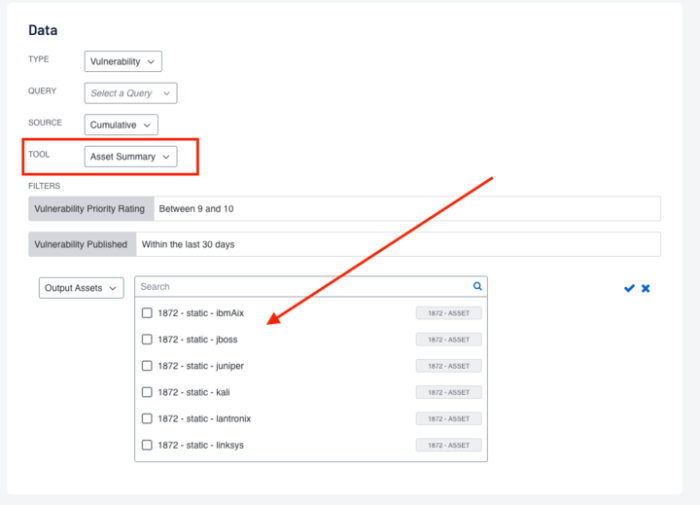
However, organisations with teams that focus on a specific group of assets benefit from using custom asset lists. Information security teams can visualise findings against assets that are "owned by" or "assigned to" specific teams within the organisation using this method. Additionally, an Output Assets filter can be set to provide greater insight into where additional resources need to be allocated to mitigate vulnerabilities.
The Output Assets filter is only available when using the Asset Summary Tool. When this tool is selected, you have the option to refine the filters to include specific Asset information.
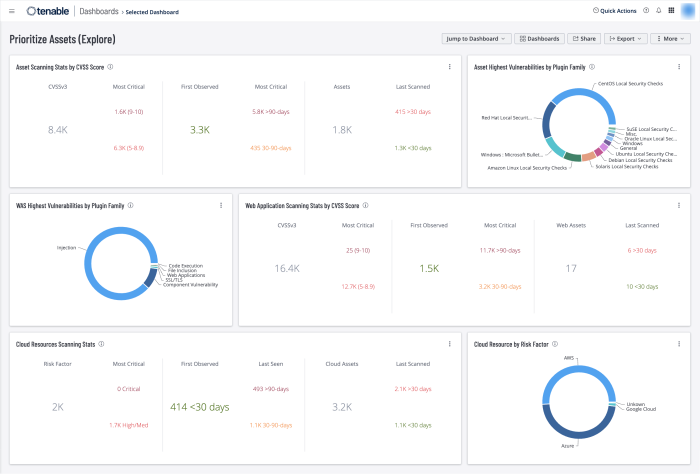
The Prioritise Assets dashboard for Tenable Vulnerability Management helps prioritise remediation efforts by presenting lists of assets to prioritise in various categories. The widgets on this dashboard leverage vulnerability information from Tenable Web Application Security (WAS), Tenable.cs, and Tenable.io Vulnerability Management (Nessus, NNM).
The data presented closes the gap in awareness for security teams and enables system administrators to prioritise patch cycles and coverage in mitigation strategies. Security teams can add target groups to the dashboard template, allowing different asset managers to prioritise remediation efforts on the risk to their specific areas of concern. System administrators can take the same dashboards as actionable items to help set the priority of corrective actions and mitigation strategies.
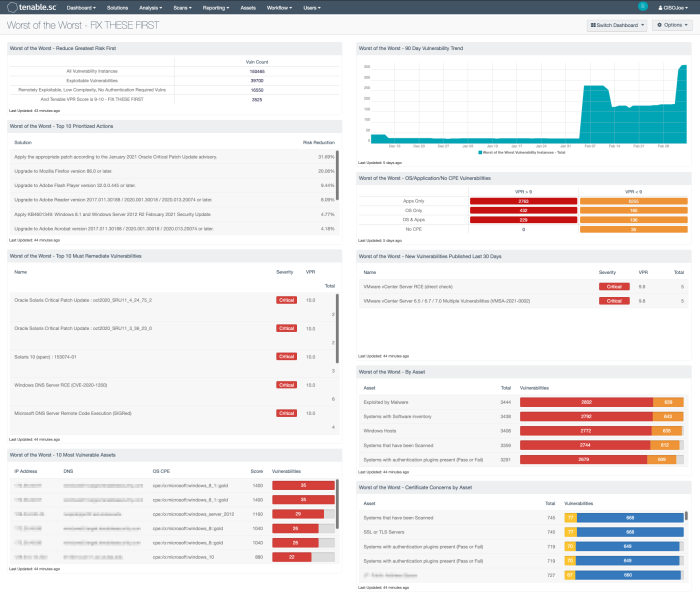
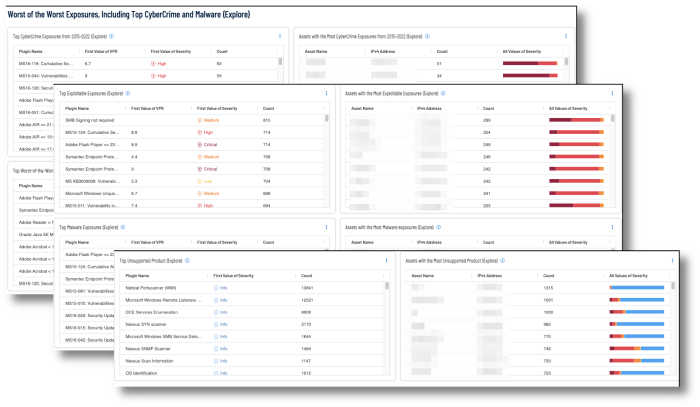
The Worst of the Worst dashboards for Tenable Security Center and Tenable Vulnerability Management enables customers building or strengthening a vulnerability management program to better visualise the modern attack surface. The information presented focuses on the vulnerabilities that organisations should prioritise and mitigate first, by leveraging the Vulnerability Priority Rating (VPR). The VPR score is an output of Predictive Prioritization, which allows organisations to focus on what matters first by combining research insights, threat intelligence, and vulnerability rating to reduce noise. Effective vulnerability remediation becomes easier as vulnerabilities that cause the most significant impact float to the top. VPR ratings can change over time, as threat intelligence information changes. Again, allowing teams to focus on what is important right now.



_thumb_700_0.png)
