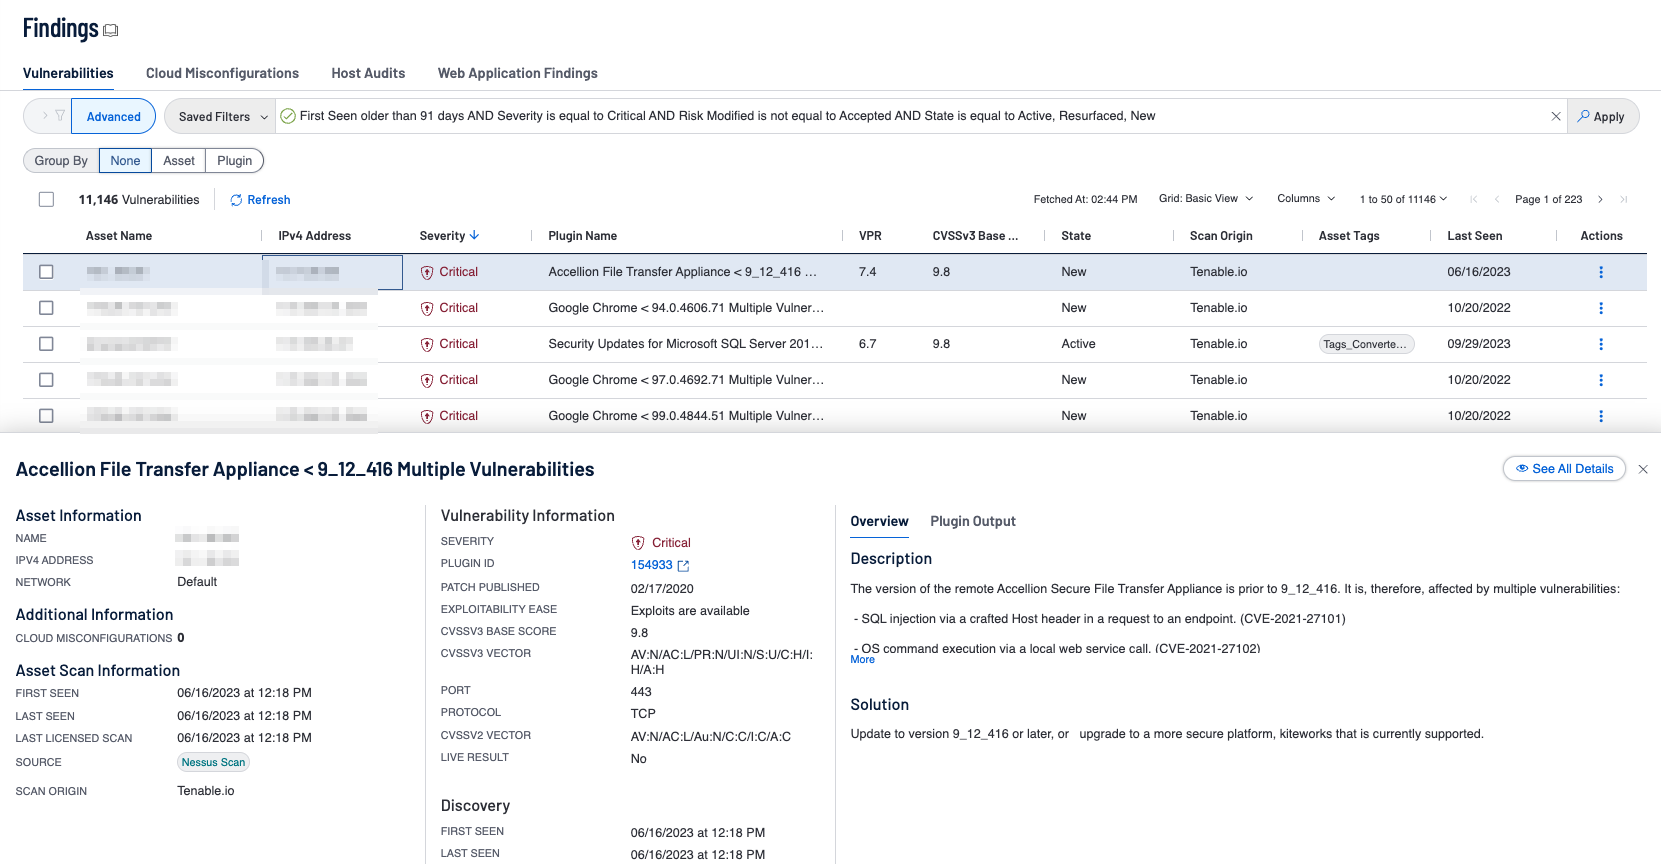
How Tenable Vulnerability Management and Tenable Security Center Can Help
Tenable Vulnerability Management contains the Fundamental Cyber Hygiene Report Card dashboard, which can be reviewed here. As vulnerabilities are identified, remediation must be prioritized and tracked in accordance with organizational goals and Service Level Agreements (SLAs). Reviewing remediated vulnerabilities and the remediation timeframe provides valuable information to the organization on the effectiveness of the risk remediation program. Three widgets focus on this area to assist organizations:
Vulnerability Age: Managing SLAs: This widget provides a view of vulnerabilities based on severity and age. The columns display counts of vulnerabilities that have been published within the specified time period and are present in the organization. The rows display the severity level of the vulnerability. Organizations can use this information to determine their compliance with organizational policy and Service Level Agreements (SLAs). For example, if an organization has a SLA that states Critical/High vulnerabilities must be patched within 45 days, any data displayed in the first three columns and two rows indicates non-compliance with the SLA. Vulnerability age is determined from the time the vulnerability was published.
Outstanding Remediations - Time Since Patch Publication: This widget displays the total count of missing patches across the environment. The matrix is composed of five columns. The first column provides a count of the vulnerabilities that are exploitable and the last four columns provide counts of vulnerabilities based on severity levels. Each row filters the vulnerabilities based on the patch publication date of less than 30 days ago, 31-90 days, 91-180 days, and greater than 181 days.
Outstanding Microsoft Remediations - Time since Patch Publication: This widget displays the total count of missing patches related to Microsoft Security Bulletins using the Windows: Microsoft Bulletins and Windows plugin families. The matrix is composed of five columns. The first column provides a count of the vulnerabilities that are exploitable and the last four columns provide counts of vulnerabilities based on severity levels. Each row filters the vulnerabilities based on the patch publication date of less than 30 days ago, 31-90 days, 91-180 days, and greater than 181 days.
Drilling down into the cells present similar details, with the exception of the filters that are used for each cell in each widget. Some of the important details to view are:
Tenable Security Center provides a Getting Started with Tenable.sc Using SLA's dashboard, more details can be found here.
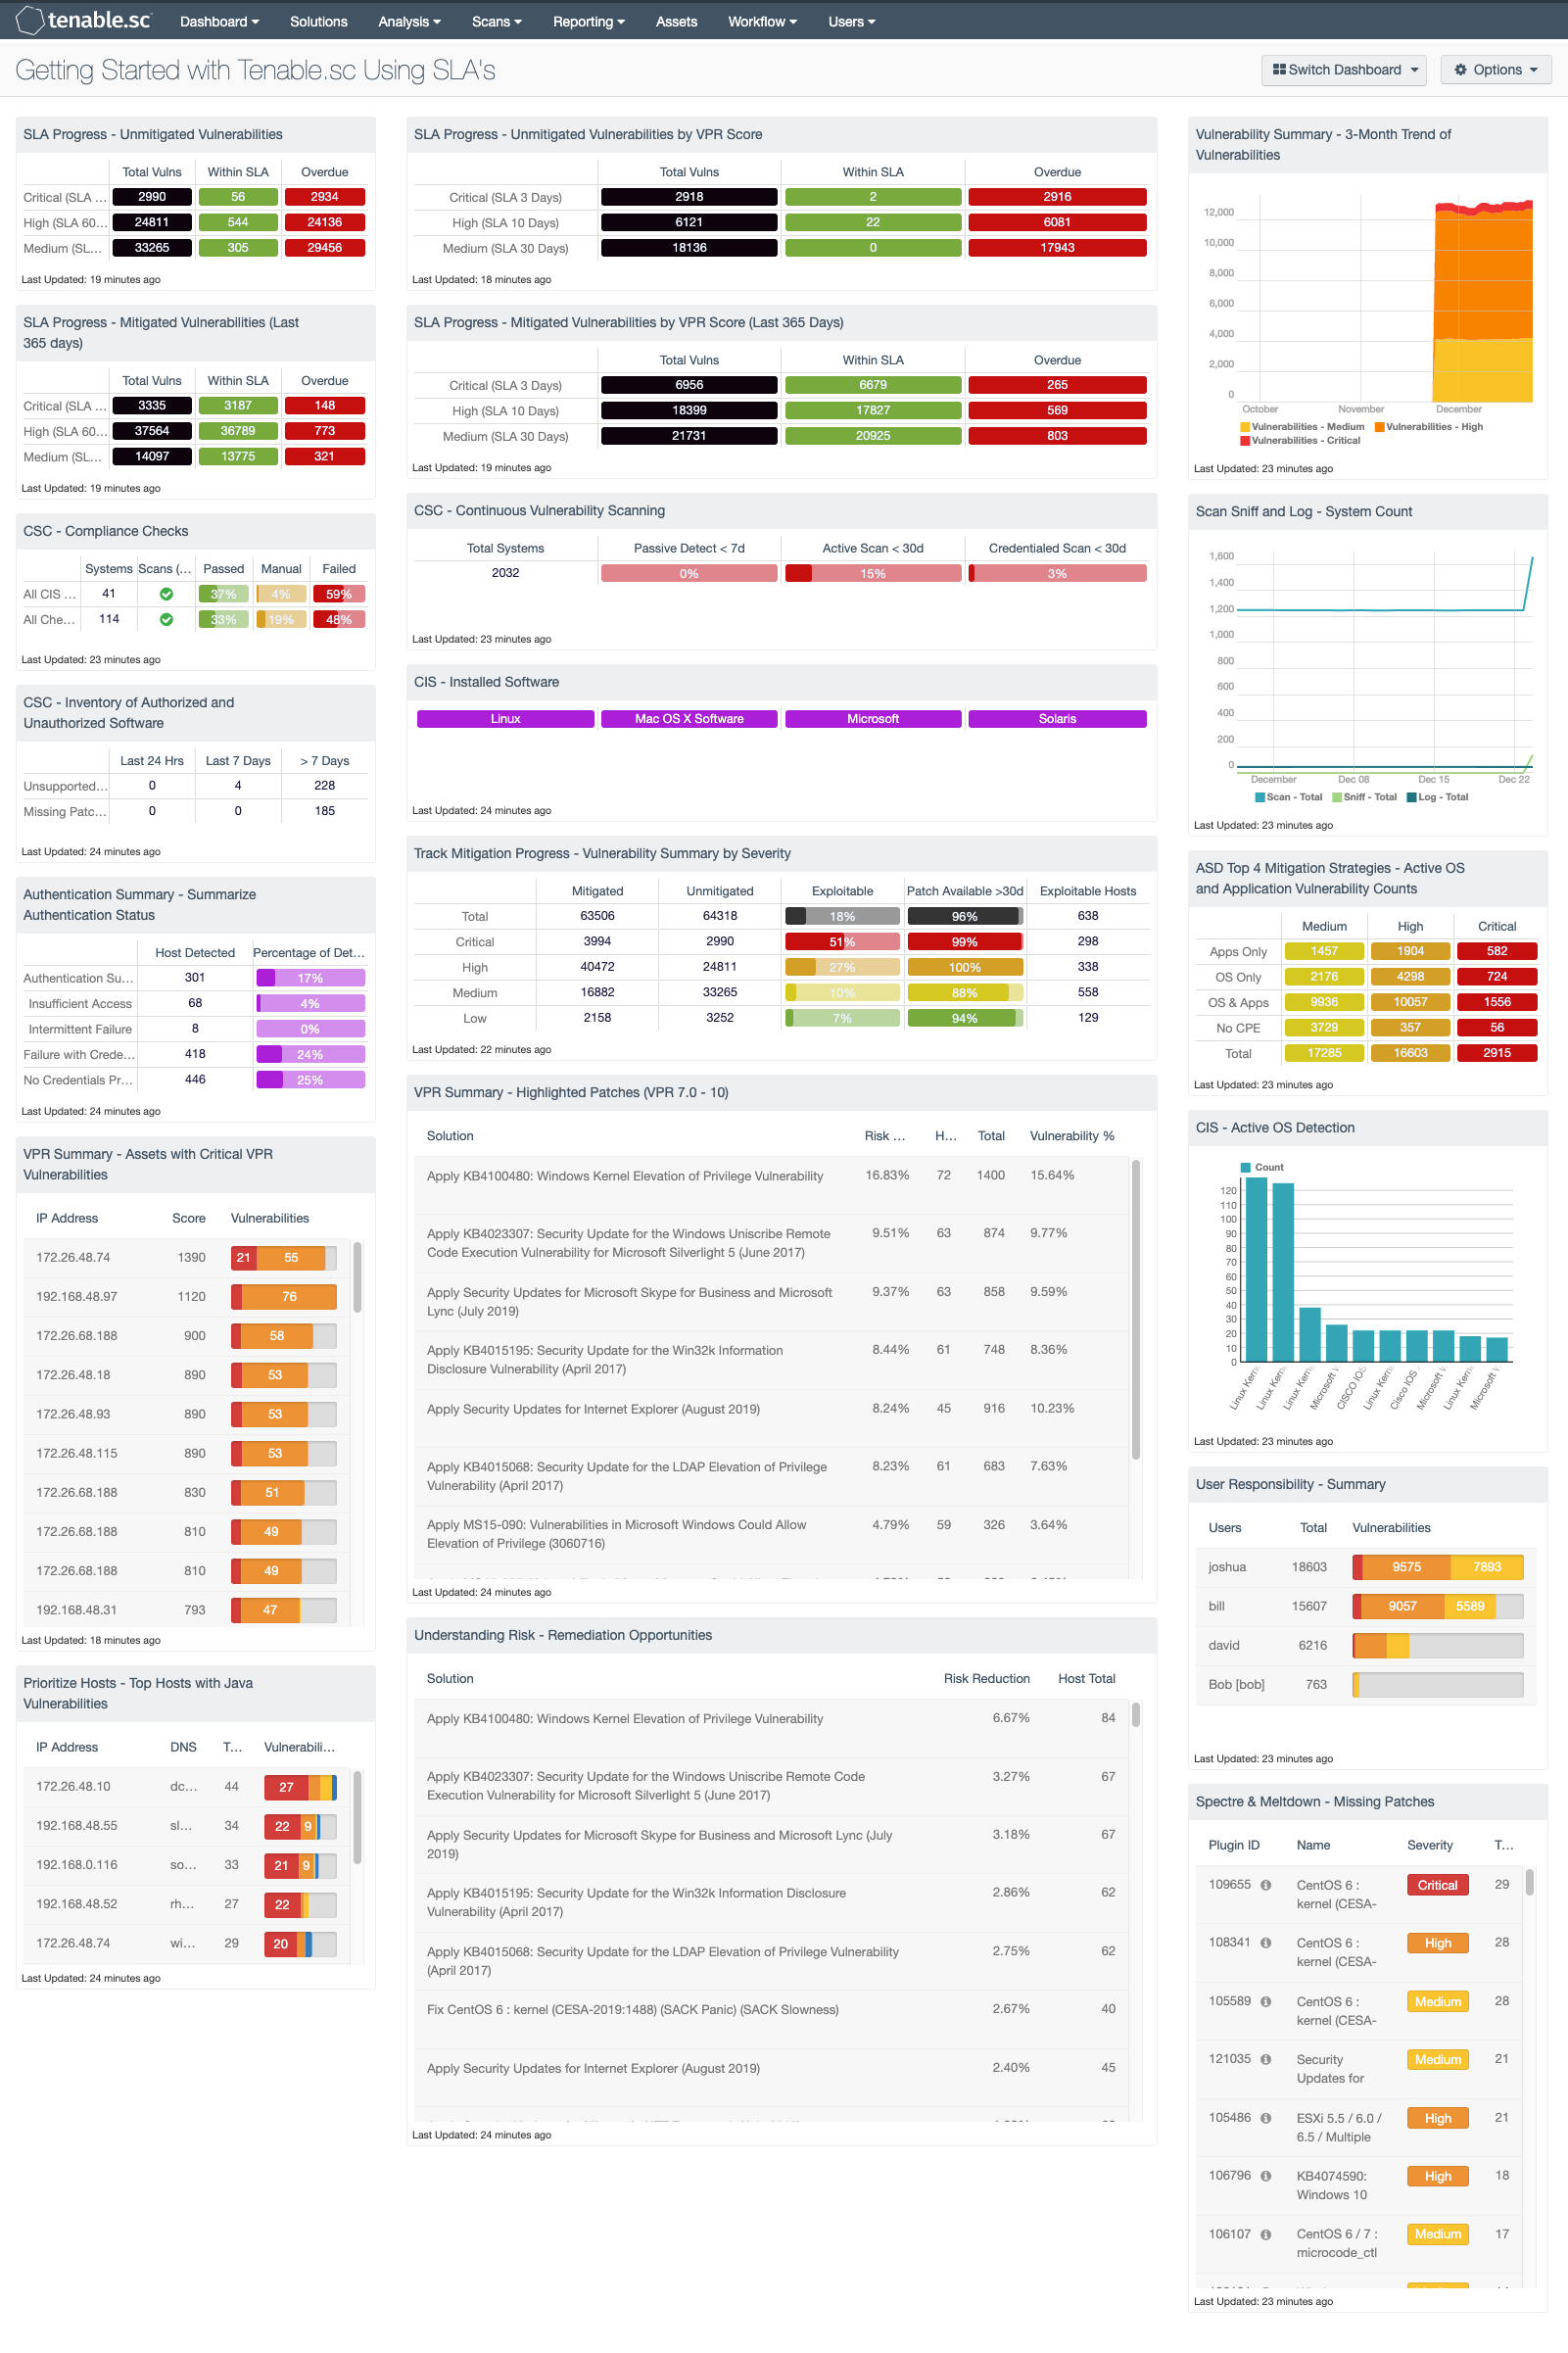
This dashboard is commonly used by the sales team at Tenable to help coach organizations to meet SLAs. The components in this dashboard are grouped in 3-series, which provide a CISO and Risk Manager with a starting point for SLA analysis.
The first few rows provide a detailed analysis on SLAs for vulnerabilities based on CVSS and VPR. Traditionally many SLAs are based on Microsoft’s Patch Tuesday and provide organizations a period of 30 days to apply newly released patches. While this is common, with Tenable’s VPR score the Risk Managers can now better understand the risk to an environment when a vulnerability is detected.
The second grouping provides overall asset detection and inventory metrics. Starting in the upper-left corner, the number of systems with completed audit checks is displayed, down to authentication statuses. The trend line on the far right provides a history of asset counts via passive and active detections.
The remaining components provide examples of how analysts can focus on specific vulnerabilities. For example, the Spectre/Meltdown vulnerabilities are detected using the CVE related to the vulnerability. Also, the most critical hosts based on VPR score are also provided. There are several different views based on different tools. For example, the Remediation Summary tools provide a series of patches available to mitigate the most risk. There are two examples, one based on the VPR score and the other based on CVSS severity. The organization can compare the two results to better understand the necessary actions needed to achieve the most risk mitigation.
All of these components together provide a starting point, which is useful throughout the Tenable customer base. Organizations are encouraged to install this dashboard and set the focus to different repositories, dynamic assets, or static assets allowing for risk to be analyzed separately. Administrators can also use this dashboard as a starting point to create their own dashboard by installing the dashboard, setting focus, and then copying the components to a common dashboard. Overall this dashboard is a great place to start when upstanding the SLA compliance.