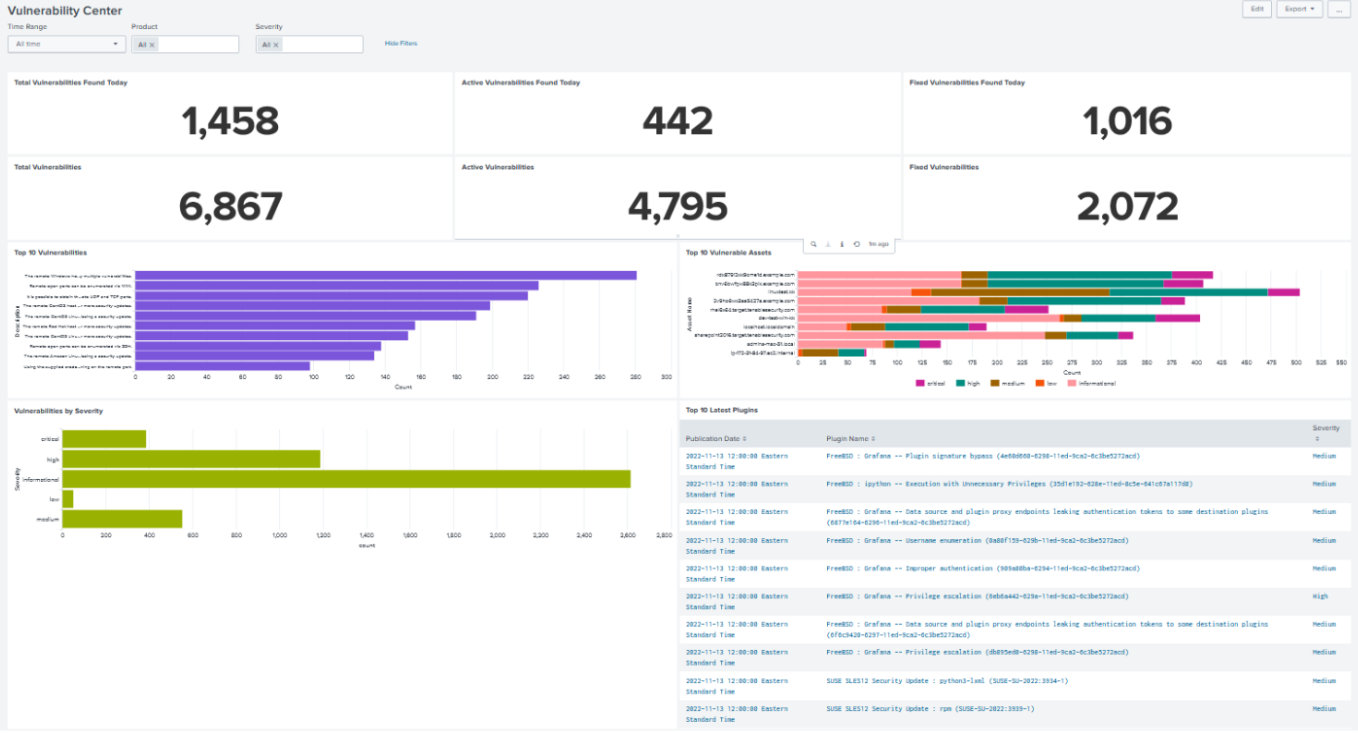
Tenable Data in Splunk Dashboard
The Tenable App for Splunk provides a single dashboard that displays all of your Tenable data.
To set up the Tenable App for Splunk:
- In Splunk, go to Settings > Advance search > Search Macros.
-
In the App section, select Tenable App for Splunk.
-
Click the search icon.
Results appear.
-
Click get_tenable_index.
The get_tenable_index macro page appears.
-
In the Definition field, update the definition to index=INDEX_NAME.
The INDEX_NAME should be the same name entered when you created the data input.
-
Click Save.
After installation, you must run the All Time saved search specific to your Tenable platform. This is a one-time operation to populate indices that the Tenable App for Splunk depends on.
- Navigate to the Tenable App for Splunk.
- Click Saved Searches.
- Select Tenable IO Plugin Data - All Time.
Splunk completes the query. -
Repeat steps 2 and 3 for other All Time saved searches:
- Tenable IO Vuln Data - All Time
- Tenable SC Vuln Data - All Time
Tenable Network Monitor Data in Splunk Dashboard
The Tenable App for Splunk provides a single dashboard showing all of your Tenable Network Monitor data. Set the following components:
Dashboard
- Total Real-time events
- Unique Real-time events
- Top 10 Events
- Top Event Trends
- Top Source IP
- Top Event Name
Traffic Overview
- Top Destination Port
- Top Source Port
- Top Destination IP
- Top Source IP
Traffic Map
- Source IP Map
- Destination IP Map
Events
- Top Events
- Events
