View Assessment Maturity Details
The following is not supported in Tenable FedRAMP Moderate environments. For more information, see the Tenable FedRAMP Product Offering.
Required Additional License: Tenable One / Tenable Lumin
Required User Role: Basic, Scan Operator, Standard, Scan Manager, or Administrator
Tenable calculates a dynamic Assessment Maturity grade that represents your overall scanning depth and frequency. For more information, see Assessment Maturity.
To view Assessment Maturity details for all assets:
-
In the upper-left corner, click the
 button.
 The left navigation plane appears.
- In the left navigation plane, click Assessment Maturity.
The Assessment Maturity page appears and, by default, shows details for your entire organization.
-
(Optional) To change the tag filter applied to the page, in the upper left corner, select a tag from the drop-down list.
Tenable Lumin filters the page by the tag you selected.
Note: All Tenable Lumin data reflects all assets within the organization's Tenable Vulnerability Management instance.
| Section or Widget | Timeframe | Assets | Action |
|---|---|---|---|
| Summary | Past 90 days | Licensed assets |
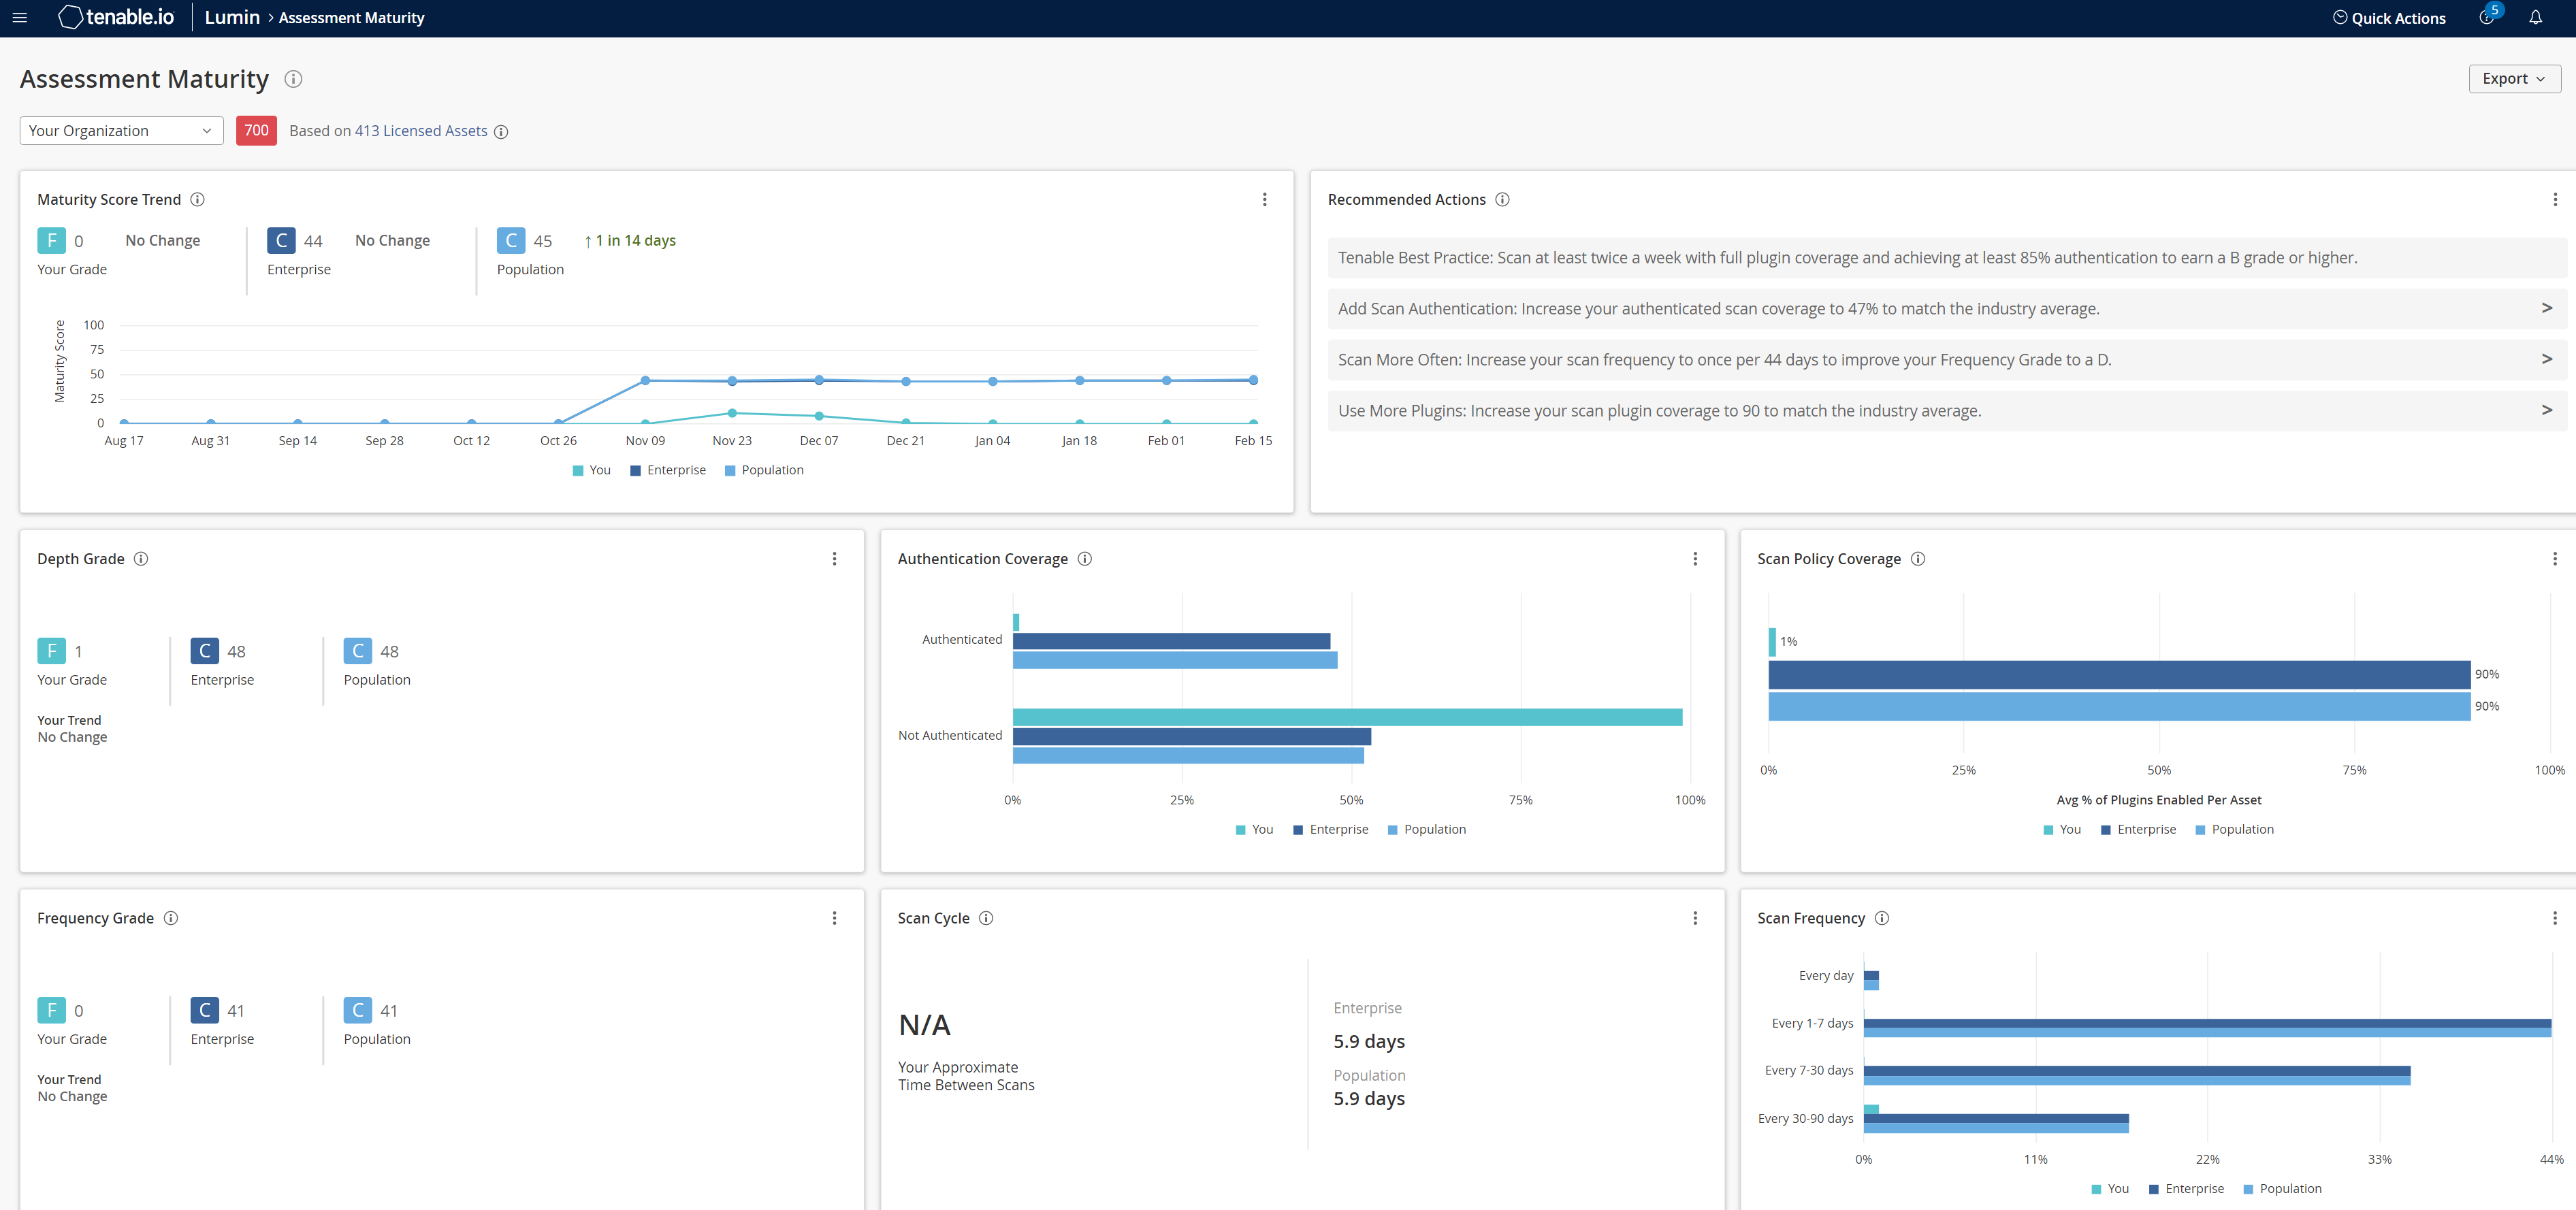
This section summarizes your Assessment Maturity grade, compared to Tenable customers in your Salesforce industry and the larger population.
|
| Maturity Score Trend
How is your Assessment Maturity grade changing over time? |
Past 90 days at each point on the graph, recalculated daily | Licensed Assets |
This widget graphs the increases and decreases to your Assessment Maturity grade and to the average Assessment Maturity grade for Tenable customers in your Salesforce industry and the larger population.
|
|
Recommended Actions What general actions can you take to improve your scanning health? |
Past 90 days | Licensed assets |
This widget provides Tenable-recommended best practices to improve your scanning health.
|
|
Depth Grade Are you scanning your assets thoroughly enough? |
Past 90 days | Licensed assets |
This widget summarizes the Assessment Maturity depth grade for your entire organization, compared to Tenable customers in your Salesforce industry and the larger population.
|
|
Authentication Coverage How often are you performing authenticated scans? |
Past 90 days | Licensed assets |
This widget graphs your percentage of assets scanned with authentication and without authentication, compared to Tenable customers in your Salesforce industry and the larger population. You can optimize your authentication coverage by ensuring you scan with successful authentication so that all plugins run on your assets.
|
| Frequency Grade
Are you scanning your assets frequently enough? |
Past 90 days | Licensed assets |
This widget summarizes the Assessment Maturity frequency grade for your entire organization, compared to Tenable customers in your Salesforce industry and the larger population. Tip: Tenable calculates your frequency grade based on how often you scan assets on your network.
|
| Scan Cycle
How much time passes between your scans? |
Past 90 days | Licensed assets |
This widget summarizes your average scan frequency, in days, compared to Tenable customers in your Salesforce industry and the larger population. Your scan cycle is the average number of days between scans for your assets. |
| Asset Scan Frequency
How often are you scanning your assets? |
Past 90 days | Licensed assets |
This widget graphs the percentage of your assets that Tenable Vulnerability Management scans daily, weekly, monthly, and quarterly, compared to Tenable customers in your Salesforce industry and the larger population.
|