View the CES Details Panel
The following is not supported in Tenable FedRAMP Moderate environments. For more information, see the Tenable FedRAMP Product Offering.
Required Additional License: Tenable One / Tenable Lumin
Required User Role: Basic, Scan Operator, Standard, Scan Manager, or Administrator
Use this page to browse CES details for your organization, or for assets with a specific business context tag.
To view CES details:
-
In the Workspace menu, click Lumin.
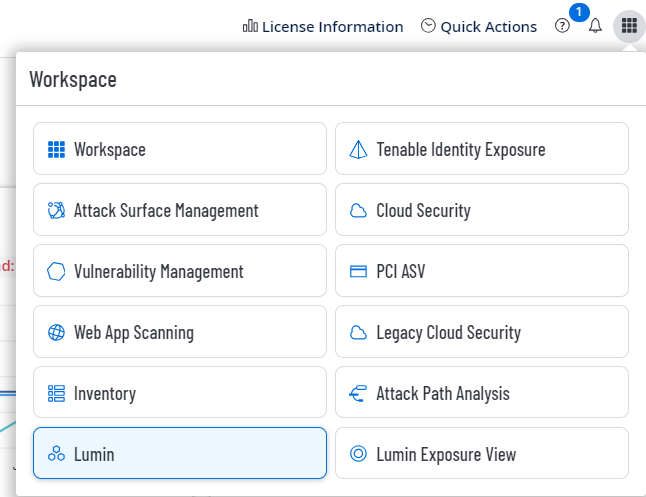
The Lumin dashboard appears.
-
Do one of the following:
-
To view CES details for your entire organization:
-
Do one of the following:
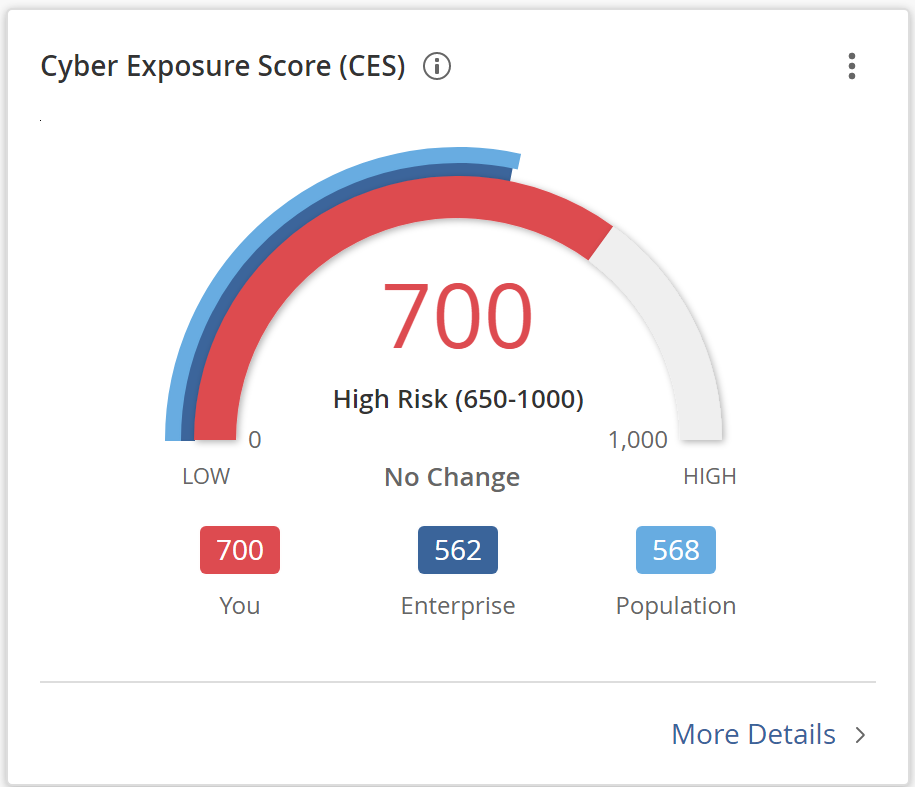
- To view current CES details, in the Cyber Exposure Score widget, click the CES value.
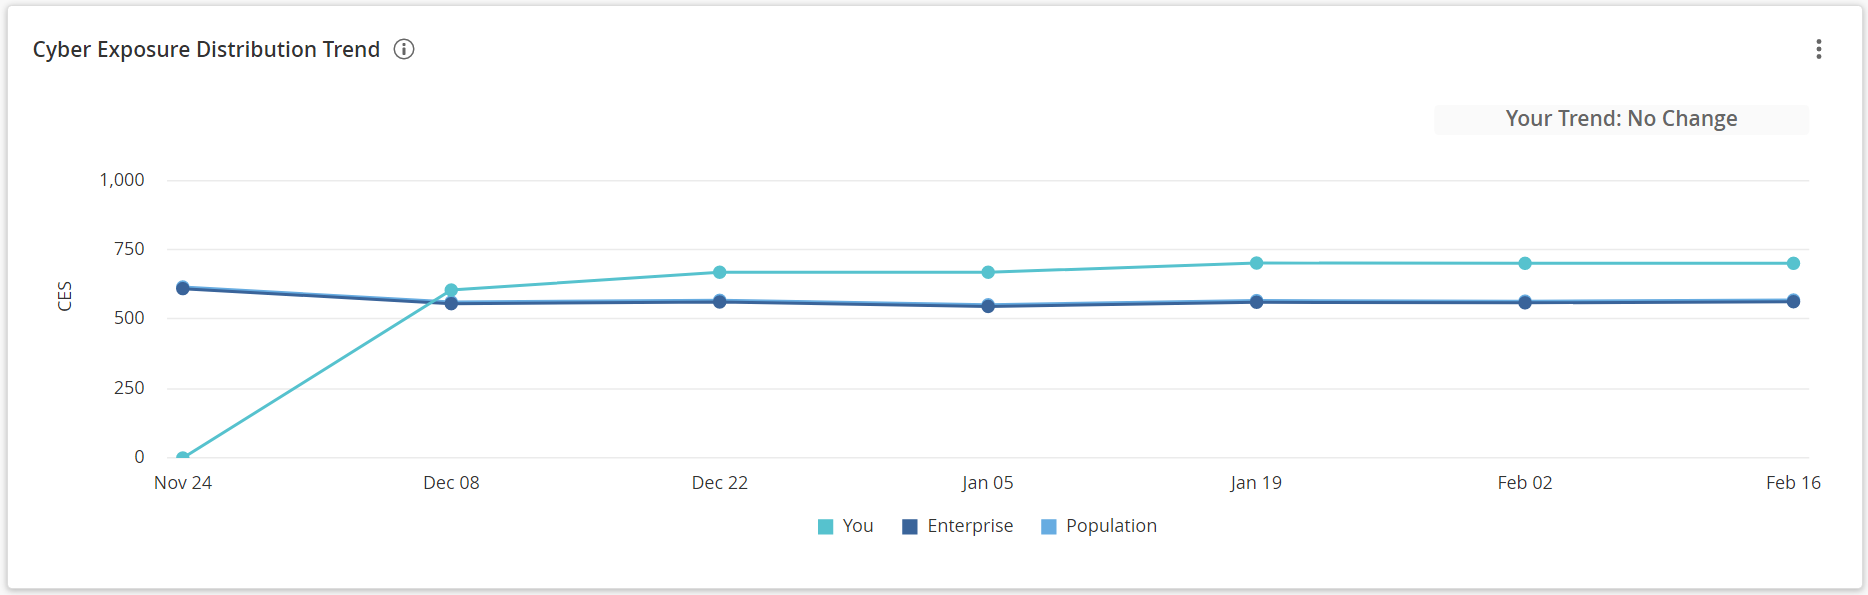
- To view historical CES details, in the Cyber Exposure Score Trend widget, click a past point on the graph.
- To view current CES details, in the Cyber Exposure Score widget, click the CES value.
-
-
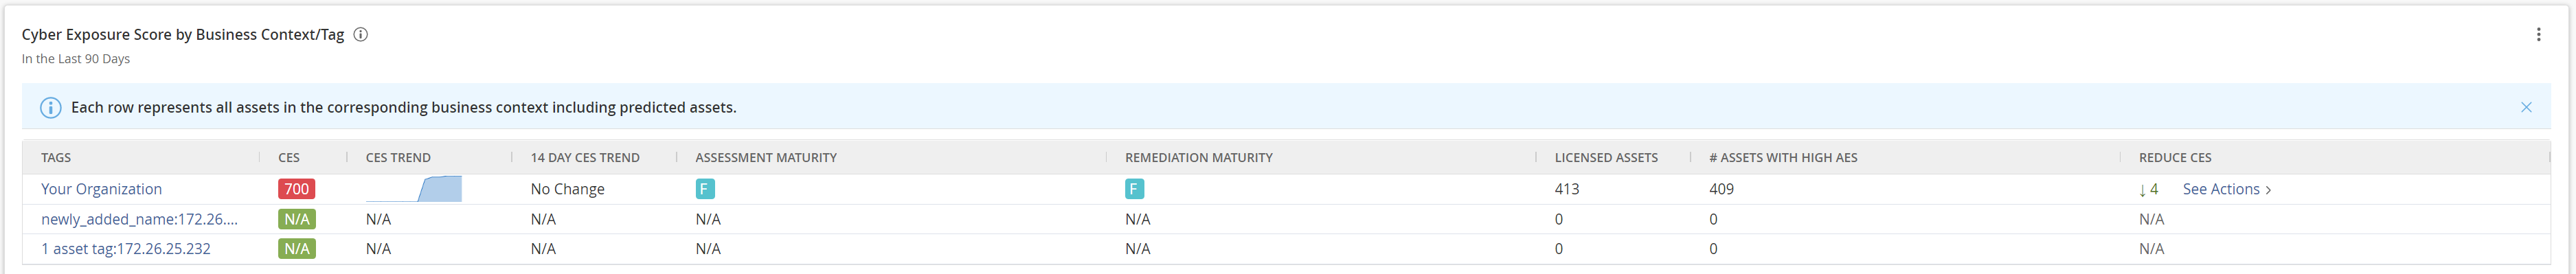
To view CES details for assets with a specific business context tag:
-
In the Cyber Exposure Score by Business Context/Tag widget, click the tag for which you want to view asset details.
The Tenable Lumin Business Context/Tag Asset Details page appears, filtered by the tag you selected.
-
In the Cyber Exposure Score Trend widget, click a CES value.
-
The Tenable Lumin Cyber Exposure Score details plane appears.
Note: All Tenable Lumin data reflects all assets within the organization's Tenable Vulnerability Management instance.
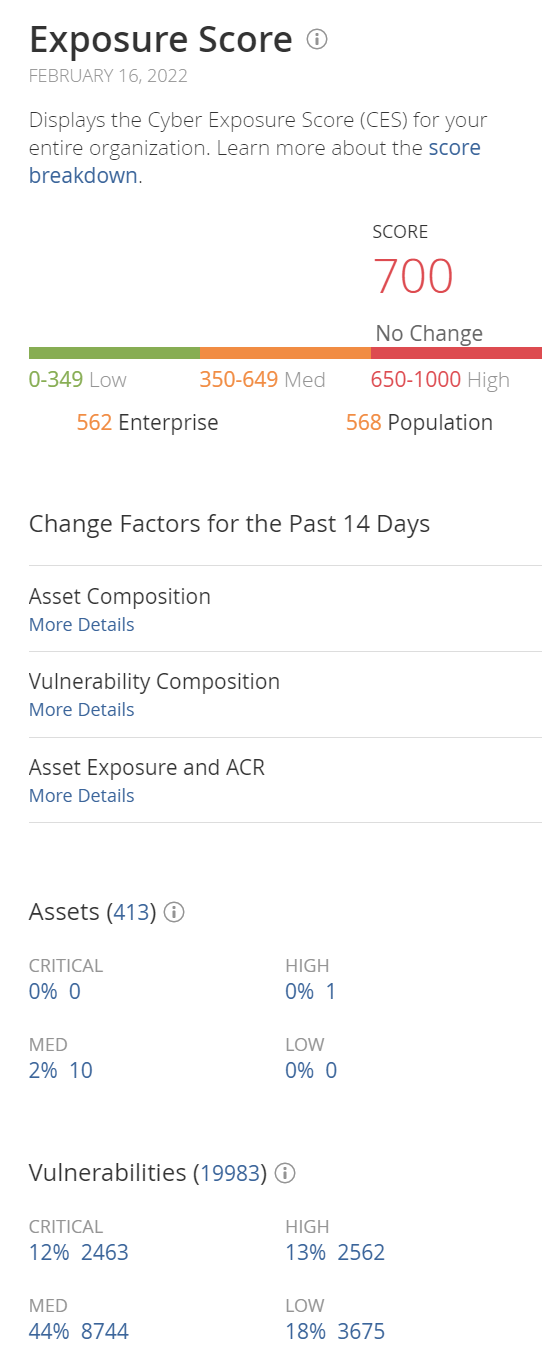
Section Timeframe Assets Action Score Past 90 days
- View the CES for your entire organization and the average CES for other Tenable customers in your Salesforce industry and the larger population.
- View the amount by which the score for your entire organization increased (
 ) or decreased (
 ) in the past 14 days.
Change Factors for the Past 14 Days Past 14 days Licensed assets -
View the major events that contributed to your score change. Tenable Vulnerability Management groups the factors by the change type:
-
CES Algorithm — Any changes related to the CES Algorithm Update.
Note: This section only appears if the algorithm update affected your CES score.
-
Asset Composition Change — Asset license changes, assets depth changes, etc.
-
Vulnerability Composition Change — Remediation of vulnerabilities, the discovery of new vulnerabilities, etc.
-
Asset Exposure and ACR Change — Any changes to your AES or ACR
-
-
To view specific details about what changed, under any change factor group, click More Details.
Tenable Lumin shows the amount by which specific drivers increased (
) or decreased () in the past 14 days.
Assets (#)
(Visible only when viewing current CES details)
All time
Licensed and unlicensed assets -
View the total number of assets.
-
For each ACR category, view the following information:
-
The percentage of assets with critical, high, medium, and low ACR values.
Tip: The percentages do not total to 100% if any of your assets are unscored.
-
The total number of assets with critical, high, medium, and low ACR values.
-
If the number of assets with critical, high, medium, and low ACR values has increased or decreased in the past 14 days, the amount by which the percentage of assets and the total number of assets increased (
) or decreased () during that time.
-
-
To view a list of assets in an ACR category, click a percentage.
The Assets page appears, filtered by licensed assets and the ACR category you selected. For more information, see Assets.
Vulnerabilities (#) (Visible only when viewing current CES details)
All time
Licensed and unlicensed assets -
View the total number of vulnerabilities present on the assets.
-
For each VPR category, view the following information:
-
The percentage of vulnerabilities with critical, high, medium, and low VPR values.
Tip: The percentages do not total to 100% if any of your assets are unscored.
-
The total number of vulnerabilities with critical, high, medium, and low VPR values.
-
If the number of vulnerabilities with critical, high, medium, and low VPR values increased or decreased in the past 14 days, the amount by which the percentage of vulnerabilities and the total number of vulnerabilities has increased (
) or decreased () during that time.
-
-
To view a list of vulnerabilities in a VPR category, click a percentage.
The Vulnerabilities page appears, filtered by licensed assets and the VPR category you selected. For more information, see Findings.
-