Findings on Assets
In the Findings on Assets panel, view a sunburst chart containing findings and assets.
Reading the chart
You can view the the chart in two tabs as follows:
-
By Tag — View the chart broken down by the ten asset tags in the initiative with the most findings.
-
By Combination — View the chart broken down by the combinations used in the initiative.
Note: Findings whose risk is accepted by an Accept rule are still included in Exposure Response initiatives.
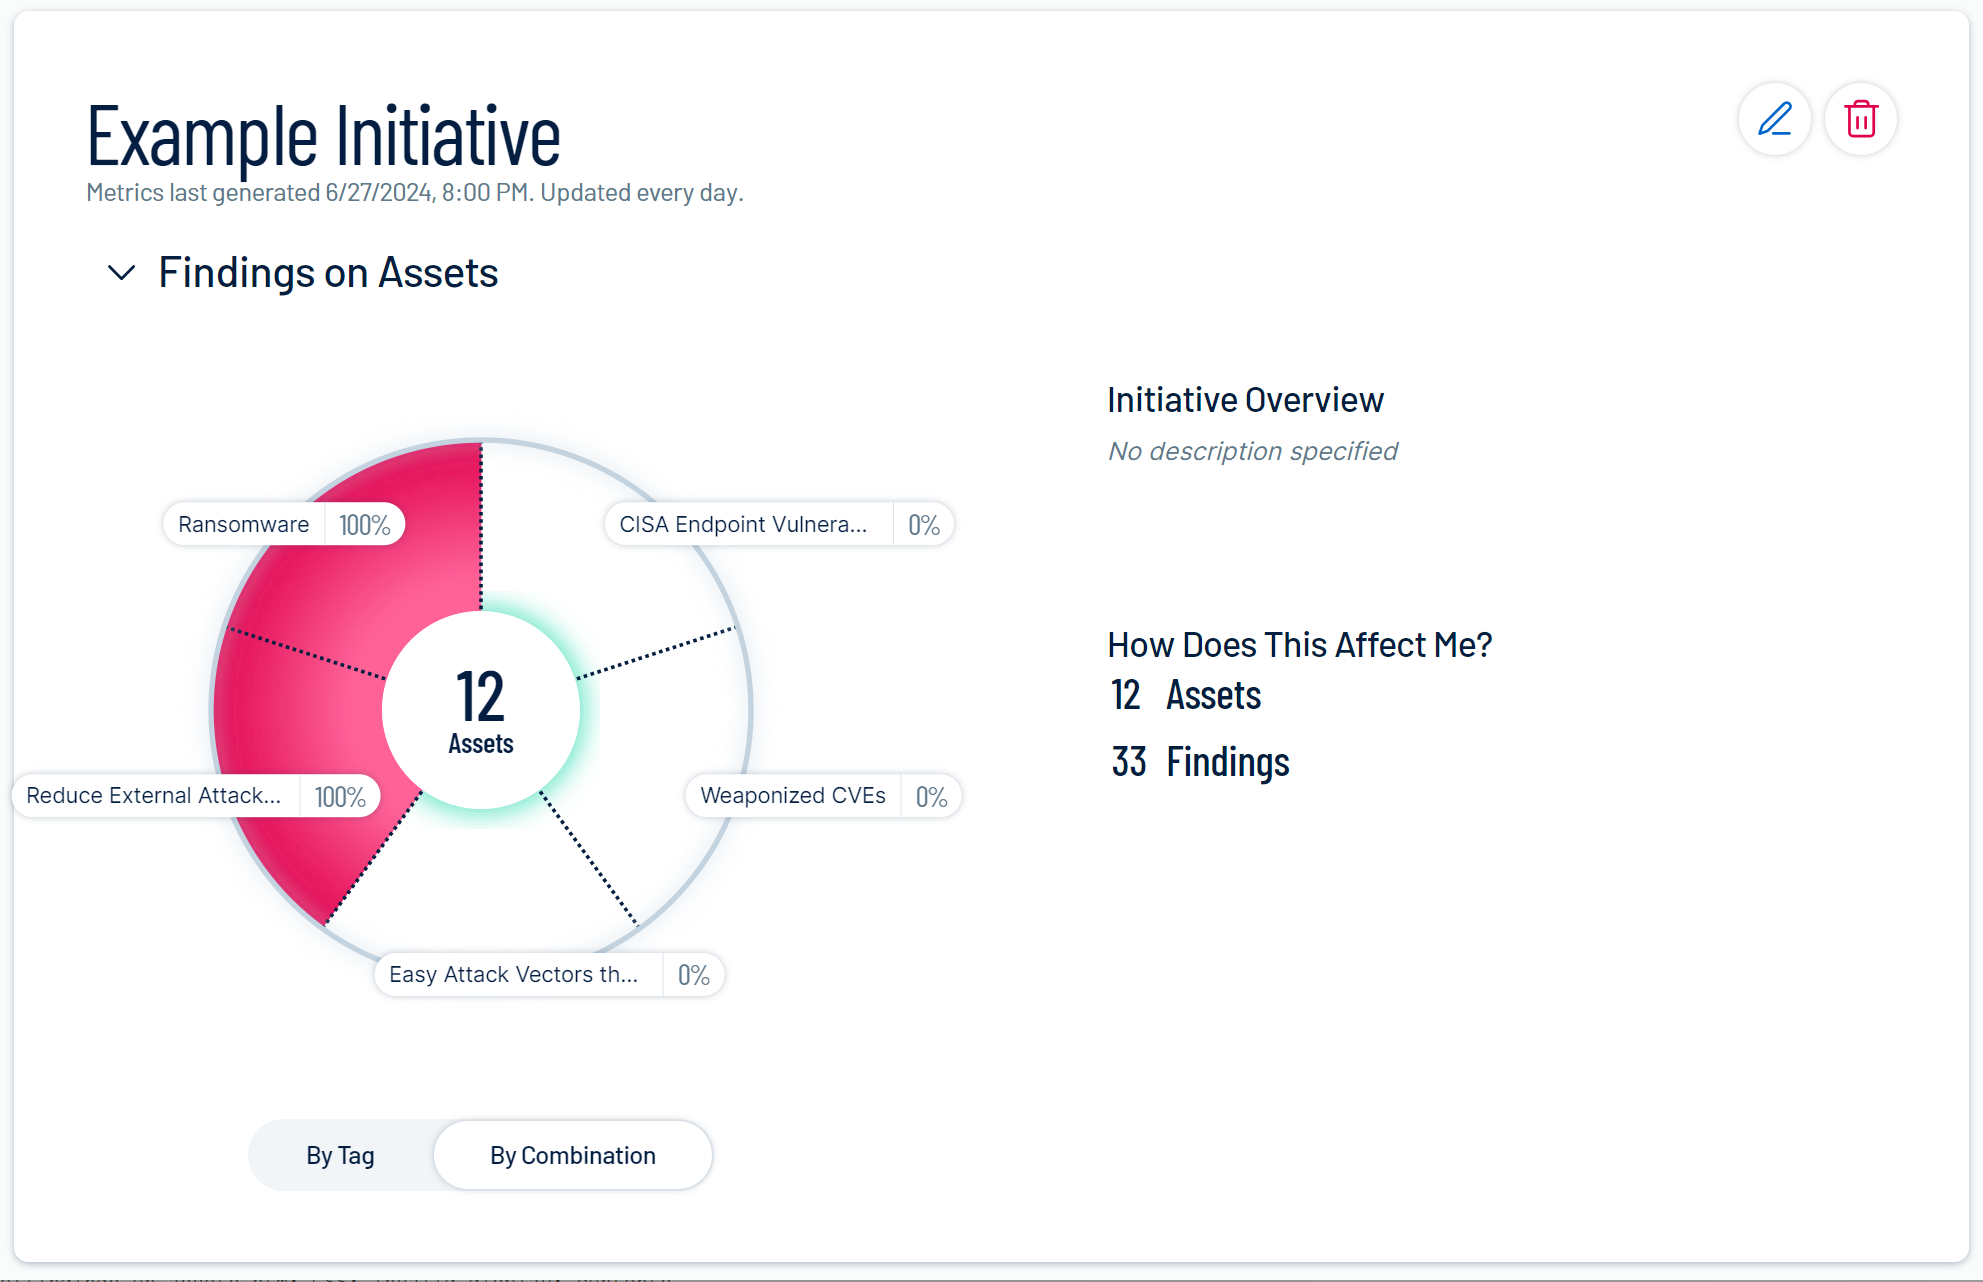
In the chart, each segment shows the percentage of assets containing a tag or a combination. The segment is colored green, yellow, or red to indicate low, medium, or high. Click a segment to open a popup with more details.
In the following example, 100% of the initiative’s assets match a combination that checks for ransomware, as shown in the top left area. Since all assets have ransomware, the segment is red.