Events
Events are notifications generated in the system to call attention to potentially harmful activity in the network. Policies that you set up in the OT Security system generate events in one of the following categories: Configuration Events, SCADA Events, Network Threats, or Network Events. OT Security assigns a severity level to each policy, indicating the severity of the event.
When you activate a policy, any event in the system that fits the policy conditions triggers an event log. Multiple events with the same characteristics are clustered together into a single cluster.
Viewing Events
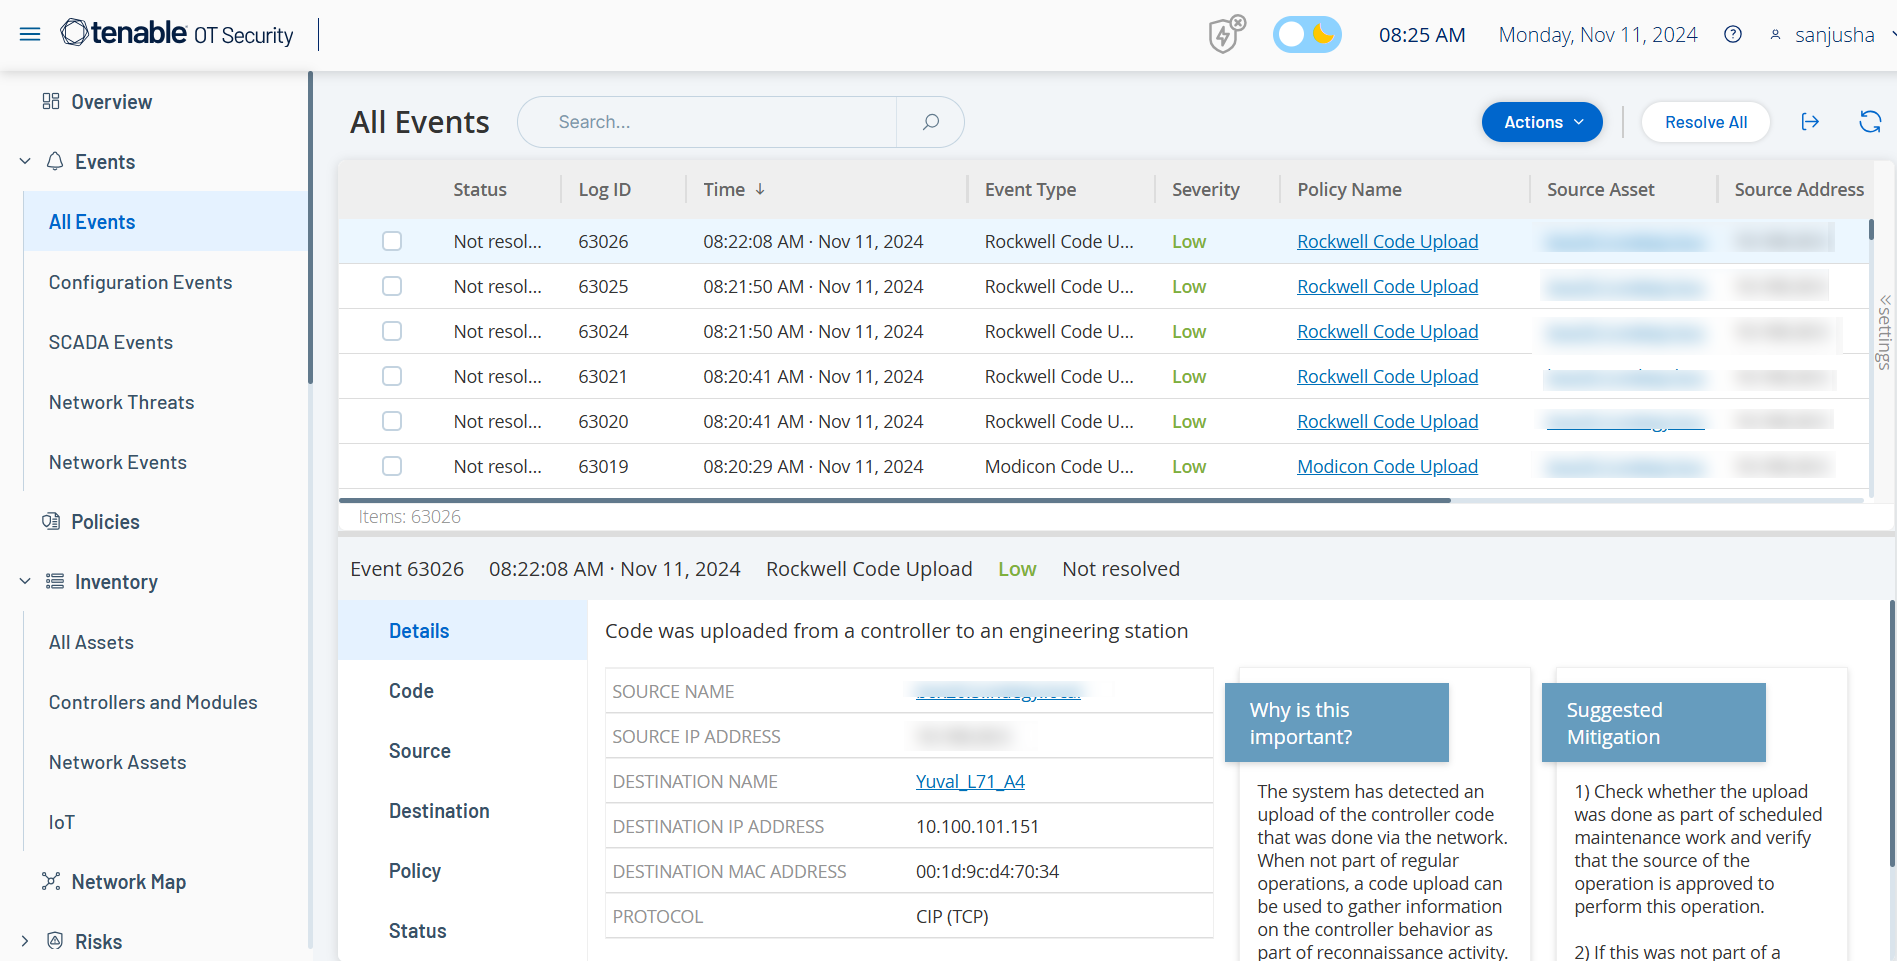
All events that occurred in the system appear on the All Events page. Specific subsets of the events appear on separate windows for each of the these event categories: Configuration Events, SCADA Events, Network Threats, and Network Events.
For each of the Events pages (Configuration Events, SCADA Events, Network Threats, and Network Events), you can customize the display settings by selecting the columns to display and the position of each column. You can group the events based on Event type, Severity, and Policy Name. You can also sort, filter, and search the event lists. For more information about the customization features, seeCustomize Tables.
You can use the Actions button in the header bar to perform the following actions:
-
Resolve – Mark this event as Resolved.
-
Download PCAP – Download the PCAP file for this event.
-
Exclude – Create a Policy Exclusion for this event.
The bottom section of the page shows information about the selected event, divided into tabs. Only tabs relevant to the Event type of the selected Event are shown. The following tabs are shown for various types of Events: Details, Code, Source, Destination, Policy, Ports Scanned and Status.
Note: You can drag the panel divider up or down to enlarge/reduce the bottom panel display.
You can download the packet capture file associated with each Event, see Network. The information shown for each Event listing is described in the following table:
| Parameter | Description |
|---|---|
| Name | The name of the device in the network. Click the name of the asset to view the Asset Details Screen for that asset, see Inventory. |
| Addresses |
The IP and/or MAC address of the asset. Note: An asset may have multiple IP addresses. |
| Type | The asset type. See Asset Types for an explanation of the various asset types. |
| Backplane | The backplane unit that the controller is connected to. Additional details about the backplane configuration are shown in the Asset Details screen. |
| Slot | For controllers that are on backplanes, shows the number of the slot to which the controller is attached. |
| Vendor | The asset vendor. |
| Family | The family name of the product as defined by the controller vendor. |
| Firmware | The firmware version currently installed on the controller. |
| Location | The location of the asset, as input by the user in the OT Security asset details. See Inventory. |
| Last Seen | The time at which the device was last seen by OT Security. This is the last time that the device was connected to the network or performed an activity. |
| OS | The OS running on the asset. |
| Log ID | The ID generated by the system to refer to the Event. |
| Time | The date and time that the Event occurred. |
| Event Type | Describes the type of activity that triggered the Event. Events are generated by Policies that are set up in the system. For an explanation of the various types of Policies, see Policy Types. |
| Severity |
Shows the severity level of the Event. The following is an explanation of the possible values: None – No reason for concern. Info – No immediate reason for concern. Should be checked out when convenient. Warning – Moderate concern that potentially harmful activity has occurred. Should be dealt with when convenient. Critical – Severe concern that potentially harmful activity has occurred. Should be dealt with immediately. |
| Policy Name | The name of the Policy that generated the Event. The name is a link to the Policy listing. |
| Source Asset | The name of the asset that initiated the Event. This field is a link to the Asset listing. |
| Source Address | The IP or MAC of the asset that initiated the Event. |
| Destination Asset | The name of the asset that was affected by the Event. This field is a link to the Asset listing. |
| Destination Address | The IP or MAC of the asset that was affected by the Event. |
| Protocol | When relevant, this shows the protocol used for the conversation that generated this Event. |
| Event Category |
Shows the general category of the Event.
Note: On the All Events screen, Events of all types are shown. Each of the specific Event screens shows only Events of the specified category.
The following is a brief explanation of the Event categories (for a more detailed explanation see Policy Categories and Sub-Categories):
|
| Status | Shows whether or not the Event has been marked as resolved. |
| Resolved By | For resolved Events, shows which user marked the Event as resolved. |
| Resolved On | For resolved Events, shows when the Event was marked as resolved. |
| Comment | Shows any comments that were added when the Event was resolved. |
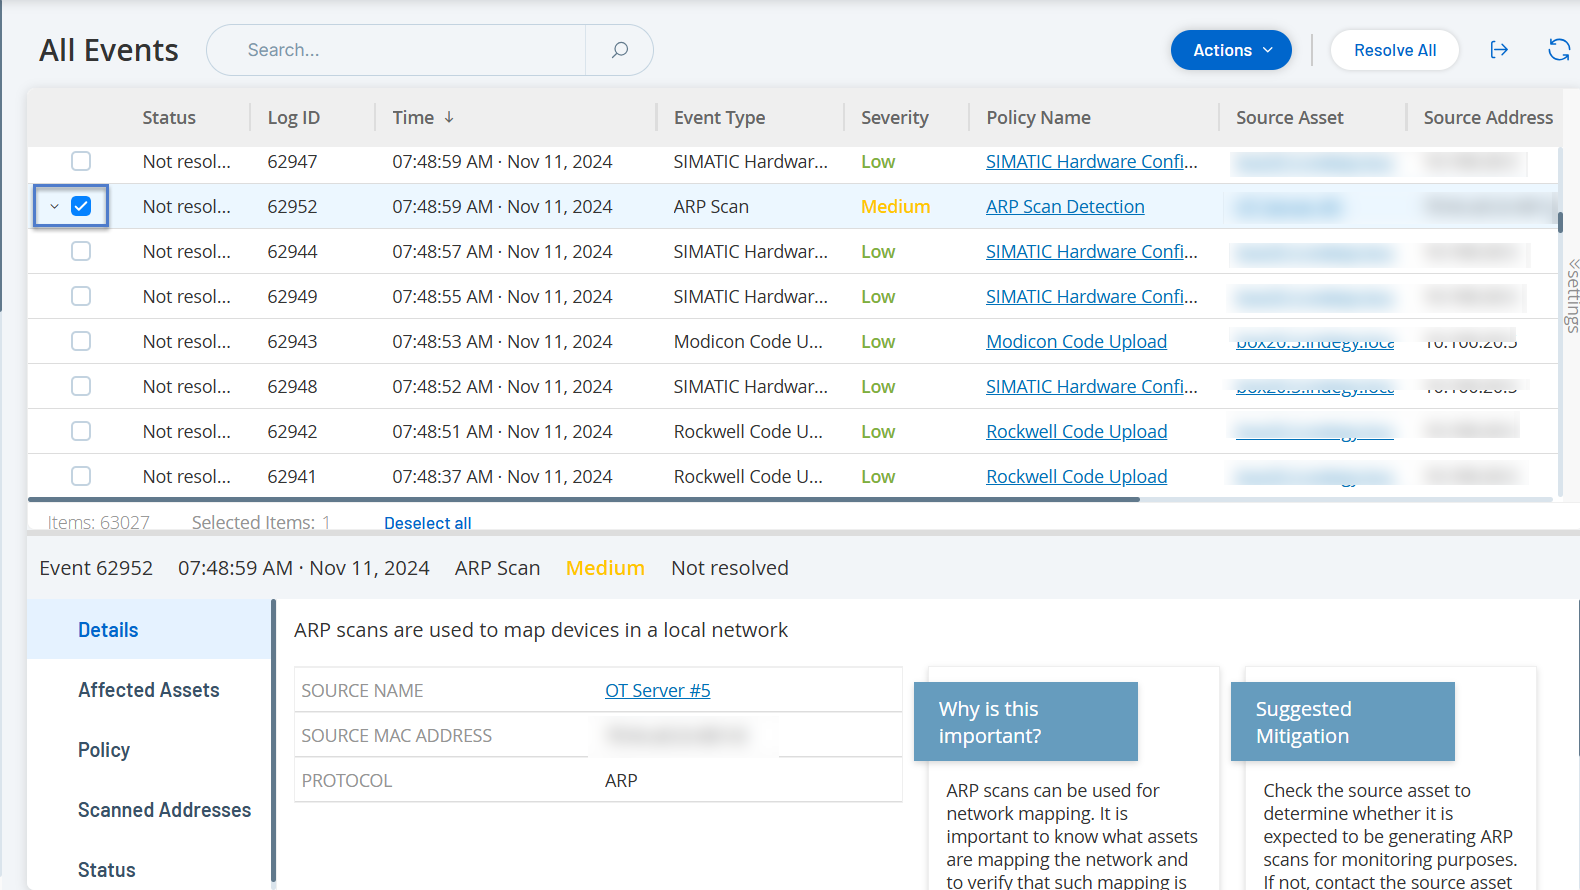
Viewing Event Details
The bottom of the Events page shows additional details about the selected Event. The information is divided into tabs. Only tabs that are relevant for the selected Event are displayed. The detailed information includes links to additional information about the relevant entities (Source Asset, Destination Asset, Policy, Group, etc.)
-
Header – shows an overview of essential info about the Event.
-
Details – gives a brief description of the Event as well as an explanation of why this information is important and suggested steps that should be taken to mitigate the potential harm caused by the Event. In addition, it shows the source and destination assets that were involved in the Event.
-
Rule Details (for Intrusion Detection Events) – shows information about the Suricata rule that applies to the Event.
-
Code – This tab is shown for Controller activities such as code download and upload, HW configuration, and code deletion. It shows detailed information about the relevant code, including specific code blocks, rungs, and tags. The code elements are displayed in a tree structure with arrows for expanding/minimizing the details shown.
-
Source – shows detailed information about the Source Asset for this Event.
-
Destination – shows detailed information about the Destination Asset for this Event.
-
Affected Asset – shows detailed information about the Asset Affected by this Event.
-
Scanned Ports (for Port Scan Events) – shows the ports that were scanned.
-
Scanned Address (for ARP Scan Events) – shows the addresses that were scanned.
-
Policy – shows detailed information about the Policy that triggered the Event.
-
Status – shows whether or not the Event has been marked as resolved. For resolved Events, shows details about which user marked it as resolved and when it was resolved.
Viewing Event Clusters
To facilitate the monitoring of events, multiple events with the same characteristics are clustered together into a single cluster. The clustering is based on event type (that is share the same Policy), source and destination assets, and the time range in which the Events occur. For information on configuring Event Clusters, see Event Clusters.
Clustered Events are denoted with an arrow next to the Log ID. To view the individual Events in a Cluster, click on the record to expand the list.