Manage Dashboards
This article describes how to view, create, customize, and manage dashboards in Tenable One Cloud Exposure.
Get Started
Follow these steps to get started:
- Learn about:
- From the All Dashboards page, you can:
Dashboard Scopes and Visibility
-
Before you create a new dashboard, you can select its scope from the global scope dropdown.
Important: You cannot change the scope after creating a new dashboard. - This scope selection dictates which users can view and manage the dashboard.
- A dashboard's visibility is tied to the user's overall scope. Assuming the dashboard is within a user's scope, the user can view the dashboard in ANY of their scopes. For example, if a dashboard was created in the scope of Project A, the user can also see the dashboard within the scope of Project B, assuming that both projects are within the user's scope.
- Data in a given dashboard is filtered according to the currently selected scope. For example, if your current scope is Project A, the dashboard will only show data relevant to Project A.
- You can duplicate a dashboard to a different scope than the one it was created in.
View All Dashboards
You can view all dashboards (built-in and custom) from the All Dashboards page.
To view all dashboards:
- In the Cloud Exposure Console, navigate to Dashboards > All Dashboards.
- (Optional) Select a scope.
-
View and manage dashboards. The following data is available in the table:
Column Description Name The name of the dashboard. Scope Indicates the organizational level or account path to which the dashboard belongs. The dashboard is accessible to users with permissions in the selected scope. Visibility Shows whether the dashboard is publicly accessible or private.
- Public — Visible to any user in the dashboard scope.
- Private — Only visible to the dashboard creator.
To change the visibility of a custom dashboard, edit the dashboard.
Modified By Identifies the user who last made changes to the dashboard. Built-in dashboards are listed as modified by Tenable. Home / Favorite


- Home — Set a default dashboard that will be displayed every time you click on the Dashboards menu item. This allows you to have your most important security information front and center.
- Favorite — Mark your most-used dashboards as Favorites. This gives you easier access and visibility to the dashboards you need most often.
Three dots
Create a Custom Dashboard
You can create custom dashboards to:
- Design and personalize dashboards to display relevant metrics, findings, and visualizations.
- Control visibility, by making them private or public.
To create a custom dashboard:
- In the Cloud Exposure Console, navigate to Dashboards > All Dashboards.
-
(Optional) Select a scope.
Important: You cannot change the scope after creating the new dashboard. - Click + New Dashboard.
- Enter a name for the board.
-
Choose whether the board is Private or Public.
Note: If you choose Public, only Collaborator or Administrator users can create, edit, and delete this dashboard (or a custom role that includes the Dashboards - Manage permission). Any Cloud Exposure user can view it within its scope. -
Click + Add Widgets. See Widgets for more information about widget content.
Note: MTTR widgets include configurable SLA configuration fields per severity.- Filter widgets in the library by category.
- Drag and drop widgets from the library.
- Rearrange widgets on the board.
- Duplicate or Remove widgets from the board.
- When finished, click Save.
Create Focused Dashboards with Filtered Widgets
See side-by-side comparisons of specific data subsets by adding the same widget multiple times and applying different filters to each.
Custom dashboards allow you to create highly specific and comparative views of your security data. A powerful technique is to add the same widget multiple times to a single dashboard, applying different filters (see Use Advanced Filters for more information) to each instance. This enables side-by-side comparisons of specific data subsets, offering immediate insights without navigating away from your dashboard.
For example, you can:
- Add multiple Open Findings widgets and filter each to show findings of different severity levels.
- Add multiple Compliance widgets and filter each to show data for a different time period.
Use Advanced Filters
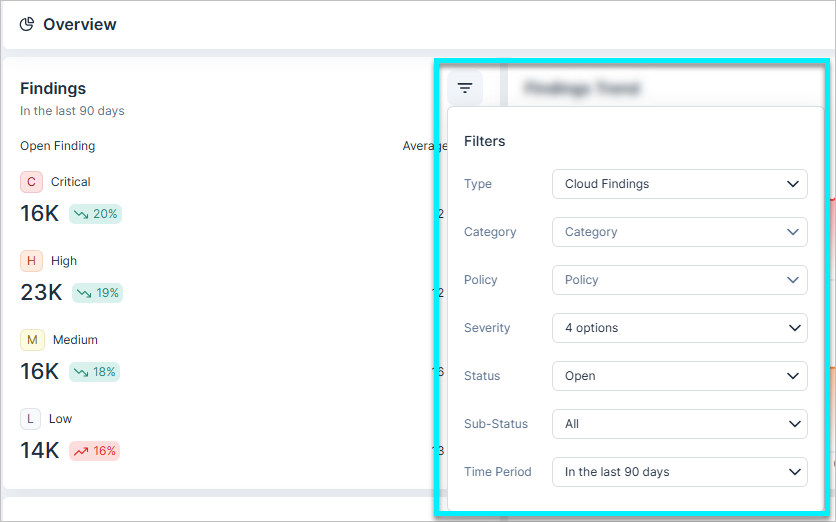
Apply powerful filters to your dashboard widgets, allowing you to narrow down the data to exactly what you need. This functionality provides a tailored and efficient way to monitor and analyze your security posture.
These filtering options are available for the following Widgets:
- Findings
- Findings Trend
- Mean Time to Handle
- Handled Findings
Duplicate a Dashboard
You can duplicate any existing dashboard (either built-in or custom) to use as a baseline for creating a new dashboard.
Note: When you duplicate a custom dashboard, the new copy is created in your current scope. This means:
- The new dashboard will only display data relevant to your current scope selection.
- If the original dashboard was configured in a different (narrower) scope, any data or specific configurations tied only to that original scope won't be included in the new version.
This behavior ensures the new dashboard accurately reflects your current context and avoids showing irrelevant information.
To duplicate a dashboard:
-
In the Cloud Exposure Console, navigate to either:
- Dashboards > All Dashboards
- The specific dashboard you want to duplicate.
-
(Optional) Select a scope.
Important: You cannot change the scope after creating the new dashboard. - Click the three dots icon and then Duplicate.
- Edit the name of the board.
- Choose whether the board is Private or Public.
-
Click + Add Widgets. See Widgets for more information about widget content.
- Filter widgets in the library by category.
- Drag and drop widgets from the library.
- Rearrange widgets on the board.
- Duplicate or Remove widgets from the board.
- When finished, click Save.
Create a Report
Create scheduled or on-demand reports based on public dashboards to simplify how you share insights with stakeholders. For example, you can create reports for executive overviews or findings trends to ensure that stakeholders receive actionable platform data automatically.
- Dynamic updates — Once a report is connected to a specific dashboard, it stays in sync. If you update the widgets or change the dashboard name, the report will automatically reflect those changes in the next delivery.
- Deletion protection — To maintain reporting consistency, a public dashboard cannot be deleted or marked as private if it is currently used in a scheduled report.
To create a report:
-
In the Cloud Exposure Console, navigate to either:
- Dashboards > All Dashboards
- The specific public dashboard you want to create a report for.
- (Optional) Select a scope.
- For the relevant dashboard (public only), click the three dots icon and then Report. The Create Report page opens.
- Enter a meaningful Name.
-
Choose a Delivery Time:
- Now — Generate a one-time report.
- Schedule — Define a cadence to generate reports at specific times. You can set custom intervals (for example, every 3 weeks, or every 6 months) and specific days of the week for weekly deliveries to ensure data arrives exactly when your team needs it.
-
Add Delivery Methods to send a copy of the report to specific recipients. See Slack or Teams for more information.
Email address
Note: For the Findings report, you can choose to send a mail per resource owner. This will send each resource owner a report of findings associated with their resources. When sending reports via email, the file size limit is 14.5MB. Larger reports are compressed or provided via a download link.- Slack channels
- Teams channels
- Click Create or Schedule.
Edit a Dashboard
You can edit custom dashboards if you are a Collaborator/Administrator, or if you created a private dashboard.
Edit a dashboard to:
- Change its visibility (private/public)
- Add or remove widgets
- Rename the dashboard
To edit a dashboard:
-
In the Cloud Exposure Console, navigate to either:
- Dashboards > All Dashboards
- The specific dashboard you want to edit.
- (Optional) Select a scope.
- Click the three dots icon and then Edit.
- Edit the name of the board.
- (Administrator/Contributor only) Choose whether the board is Private or Public.
-
Click + Add Widgets. See Widgets for more information about widget content.
- Filter widgets in the library by category.
- Drag and drop widgets from the library.
- Rearrange widgets on the board.
- Duplicate or Remove widgets from the board.
- When finished, click Save.