Dashboard Overview
Required User Role: Administrator or Custom Role
The following is not supported in Tenable FedRAMP Moderate environments. For more information, see the Tenable FedRAMP Product Offering.
You can drill into any dashboard on the Dashboards page to view the dashboard's overview.
- Only licensed assets are included in dashboard data.
- Dashboard data refreshes every 24 hours.
- By default, Tenable Exposure Management retains dashboard data within the user interface for 90 days. To access this data after this point, contact your Tenable representative.
- Dashboards only include data from tags created within Tenable Exposure Management. Dashboards do not include tag data from other Tenable applications or third-party sources.
- Tags do not apply to widgets or dashboards that display detection count data. If you apply a tag to a dashboard or widget that shows detection count figures, those figures do not filter or change.
- To see Asset Criticality Rating, Asset Exposure Score, and Cyber Exposure Score data on your dashboards, you must use the Legacy Tenable One or Tenable One Advanced licensing packages. For more information, see Tenable One Foundation / Tenable One Advanced Licensing in the Tenable Licensing Quick Reference Guide.
To view a dashboard overview:
-
Access the Dashboards page.
-
Click the tile of the dashboard for which you want to view the overview.
The dashboard overview appears.

On the dashboard overview page, you can:
-
View the dashboard's name.
-
View the owner of the dashboard.
-
In the upper-right corner, use the date range drop-down to select the date range for which you want to view data on the dashboard.
-
View details about the widgets within your dashboard. The data on each widget depends on the type of widget and the configurations applied during creation.
In the upper-right corner of each widget, you can interact with and manage your dashboard's widgets. These options include, but are not limited to:
Note: The widget management options depend on the type of widget you're managing. Not all widget types include these options.-
Hover over the
 button to view a brief description of the data on the widget.
 -
If you've drilled down into a specific data point, click the
 button to drill back up to the main data within the widget.
 -
If you're at the top level of widget data, click the
 button to turn on drill down mode. Once on, you can click a data point on the graph to drill down into that specific data point for more detailed information.
 -
Click the
button to drill down to the lowest level of data available on the widget. -
Click the
 button to view additional options for viewing and exporting widget data.
 -
Click the filter button to view all filters affecting the widget:

-
You can also manage the page in the following ways:
Apply Filters to the Dashboard Overview
| Data Behavior Type | Response to Date Filter |
|---|---|
| Snapshot | No Impact. Displays the state of your environment as of the last scan/sync. |
| Historical (Point-in-Time) | Filtered by End-Date. Displays data from the latest available date within your chosen range. |
| Time-Dimension | Fully Dynamic. Trends data across the entire selected duration. |
To apply one or more filters to the dashboard overview:
-
In the upper-right corner of the dashboard, click the
 Filters button.
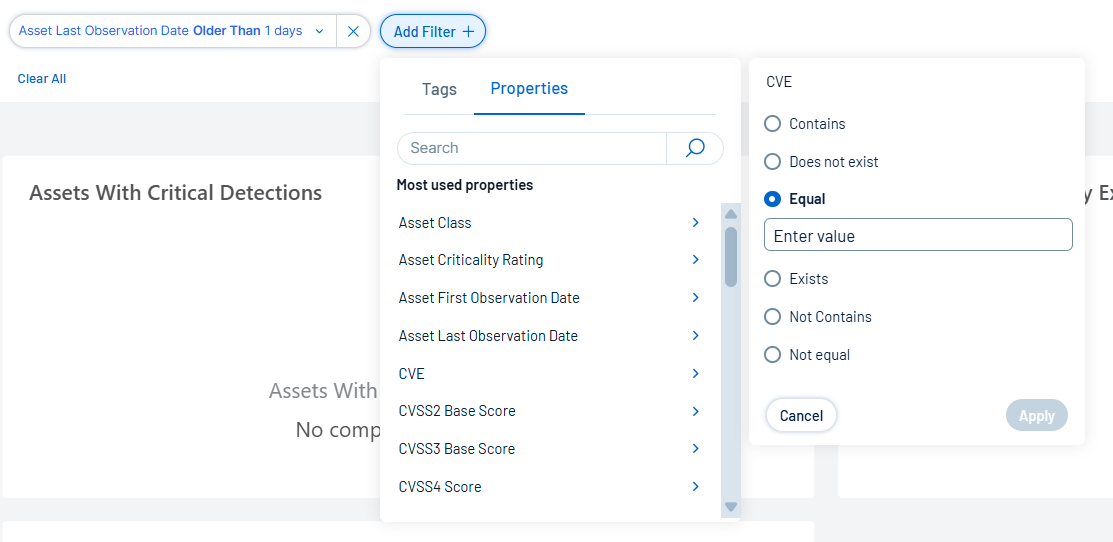
 The Add filter
 button appears.
 -
Click Add filter
.A menu appears.
-
Do one of the following:
-
To filter the dashboard by tag, click Tags.
-
To filter the dashboard by property, click Properties.
-
-
In the search box, type the criteria by which you want to filter the dashboard.
Tenable Exposure Management populates a list of options based on your criteria.
-
Click the tag or property by which you want to filter the dashboard.
A menu appears.
-
Select how to apply the filter. For example, if you want to search for finding related to Windows, then select the contains radio button and in the text box, type Windows.
-
Click Add filter
.The filter appears above the dashboard.
-
Repeat these steps for each additional filter you want to apply.
-
Click Apply filters.
Tenable Exposure Management filters the dashboard by the designated criteria.
View and Manage Dashboard Options
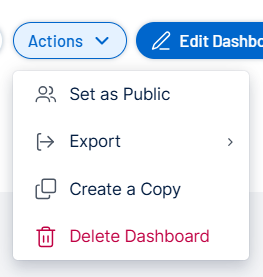
In the Actions drop-down, you can view and manage the following dashboard options:
Export the Dashboard
Required User Role: Administrator or Custom Role
You can export the dashboard and its data for easy sharing with teammates.
To export the dashboard for sharing:
-
At the top of the page, click Actions.
A menu appears.
-
Click Export.
A menu appears.
-
Select the format in which you want to export the dashboard.
Tenable Exposure Management sends the exported file to your customer email address.
Create a Copy of the Dashboard
Required User Role: Administrator or Custom Role
You can create a copy of a dashboard to use it as a template for a new dashboard.
To create a copy of the dashboard:
-
At the top of the page, click Actions.
A menu appears.
-
Click Create a Copy.
The Create a copy window appears.
-
In the Dashboard Name text box, type a name for the copied dashboard. By default, Tenable prepends "copy of" to the original dashboard name.
-
(Optional) In the Description text box, edit the dashboard description.
-
In the dashboard privacy section, select whether you want the dashboard to be Public or Private.
Note: Public dashboards are visible to all users within your Tenable Exposure Management instance. -
Click Create.
Tenable Exposure Management adds the copy of the dashboard to the Dashboards page.