Event Analysis
The Events display page contains an aggregation of security events from Tenable Log Correlation Engine. Events can be viewed in a list format with options similar to the Vulnerability interface.
Note: Log Correlation Engine events are not supported in Tenable Enclave Security.
Raw Syslog Events
Tenable Security Center’s event filters includes a Syslog Text option to narrow down the scope of a set of events, and supports the use of keyword searches for active filters.
Active vs. Archived
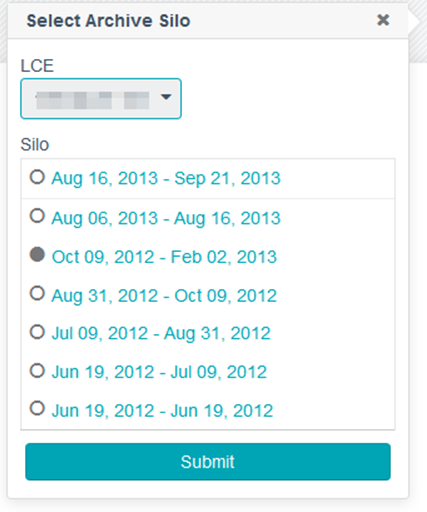
In the upper-right corner, click Active or Archived to switch between the active and archived data. This selection determines whether the displayed events are pulled from the active or an archived event database. The Active view is the default that displays all currently active events. The Archived view prompts for the selection of the Log Correlation Engine and an Archive Silo from which the event data is displayed. In the example below, the Log Correlation Engine and Silo date range are displayed to help the user choose the correct archive data for analysis.
Analysis Tools
A wide variety of analysis tools are available for comprehensive event analysis.
When viewing the analysis tool results, clicking on result will generally take you to the next level of detail for the analysis. For instance, from the Type summary page clicking on a type will display the Normalized Event Summary. Clicking on an even in that list will display the List of Events page featuring that event. Along each progression a new drop-down menu will appear allowing for easy access to either pivot to another analysis tool based on the current view or to return to the previous view.
Additionally most results will have a gear icon next to them. This icon will provide summaries, normally based on time restrictions or a view of the vulnerability summary for the affected host, around that item’s result.
For more information, see Event Analysis Tools.
Load Query
The Load Query option enables users to load a predefined query and display the current dataset against that query. Click on Load Query in the filters list to display a box with all available queries. The query names are displayed in alphabetical order. After clicking on an individual query, the vulnerability view is changed to match the query view for the current dataset.
Event Analysis Filters
For more information, see Event Analysis Filter Components.
Event Analysis Actions
You can use the Options drop-down menu to perform the following event analysis actions.
Save Query
You can save the current view as a query for reuse. For more information about queries, see Queries.
Save Asset
Event results can be saved to an asset list for later use. For more information, see Assets.
Save Watchlist
Event results can be saved to a watchlist asset list for later use. For more information, see Assets.
Open Ticket
Tickets are used within Tenable Security Center to assist with the assessment and remediation of vulnerabilities and security events. For more information, see Open a Ticket.
View Settings
When available, this setting controls the columns displayed in your view.
Switch to Archived / Switch Archive / Switch to Active
The Switch to Archived item is displayed when viewing active event data and when selected will present a dialog to choose the archived event data to display by Tenable Log Correlation Engine and date range.
The Switch Archive menu item is displayed when viewing archived event data. Selecting this option displays the same menu and selections as above to select a different archive silo for viewing.
The Switch to Active menu item is displayed when viewing archived data and when selected, changes the view to active event data for analysis.
Export as CSV
Event results can be exported to a comma-separated file for detailed analysis outside of Tenable Security Center by clicking on the Options drop-down menu and then the Export as CSV option. When selected, a window opens with an option to choose the columns to be included in the CSV file.
If the record count (rows displayed) of any CSV export is greater than 1,000 records, a note is displayed that prompts for the name of the CSV report to be generated. When complete, the report can be downloaded from the Report Results page. For CSV exports of under 1,000 records, the browser’s standard Save As dialog window is displayed.
Once the appropriate selections are made, click the Submit button to create the CSV file or Cancel to abort the process.