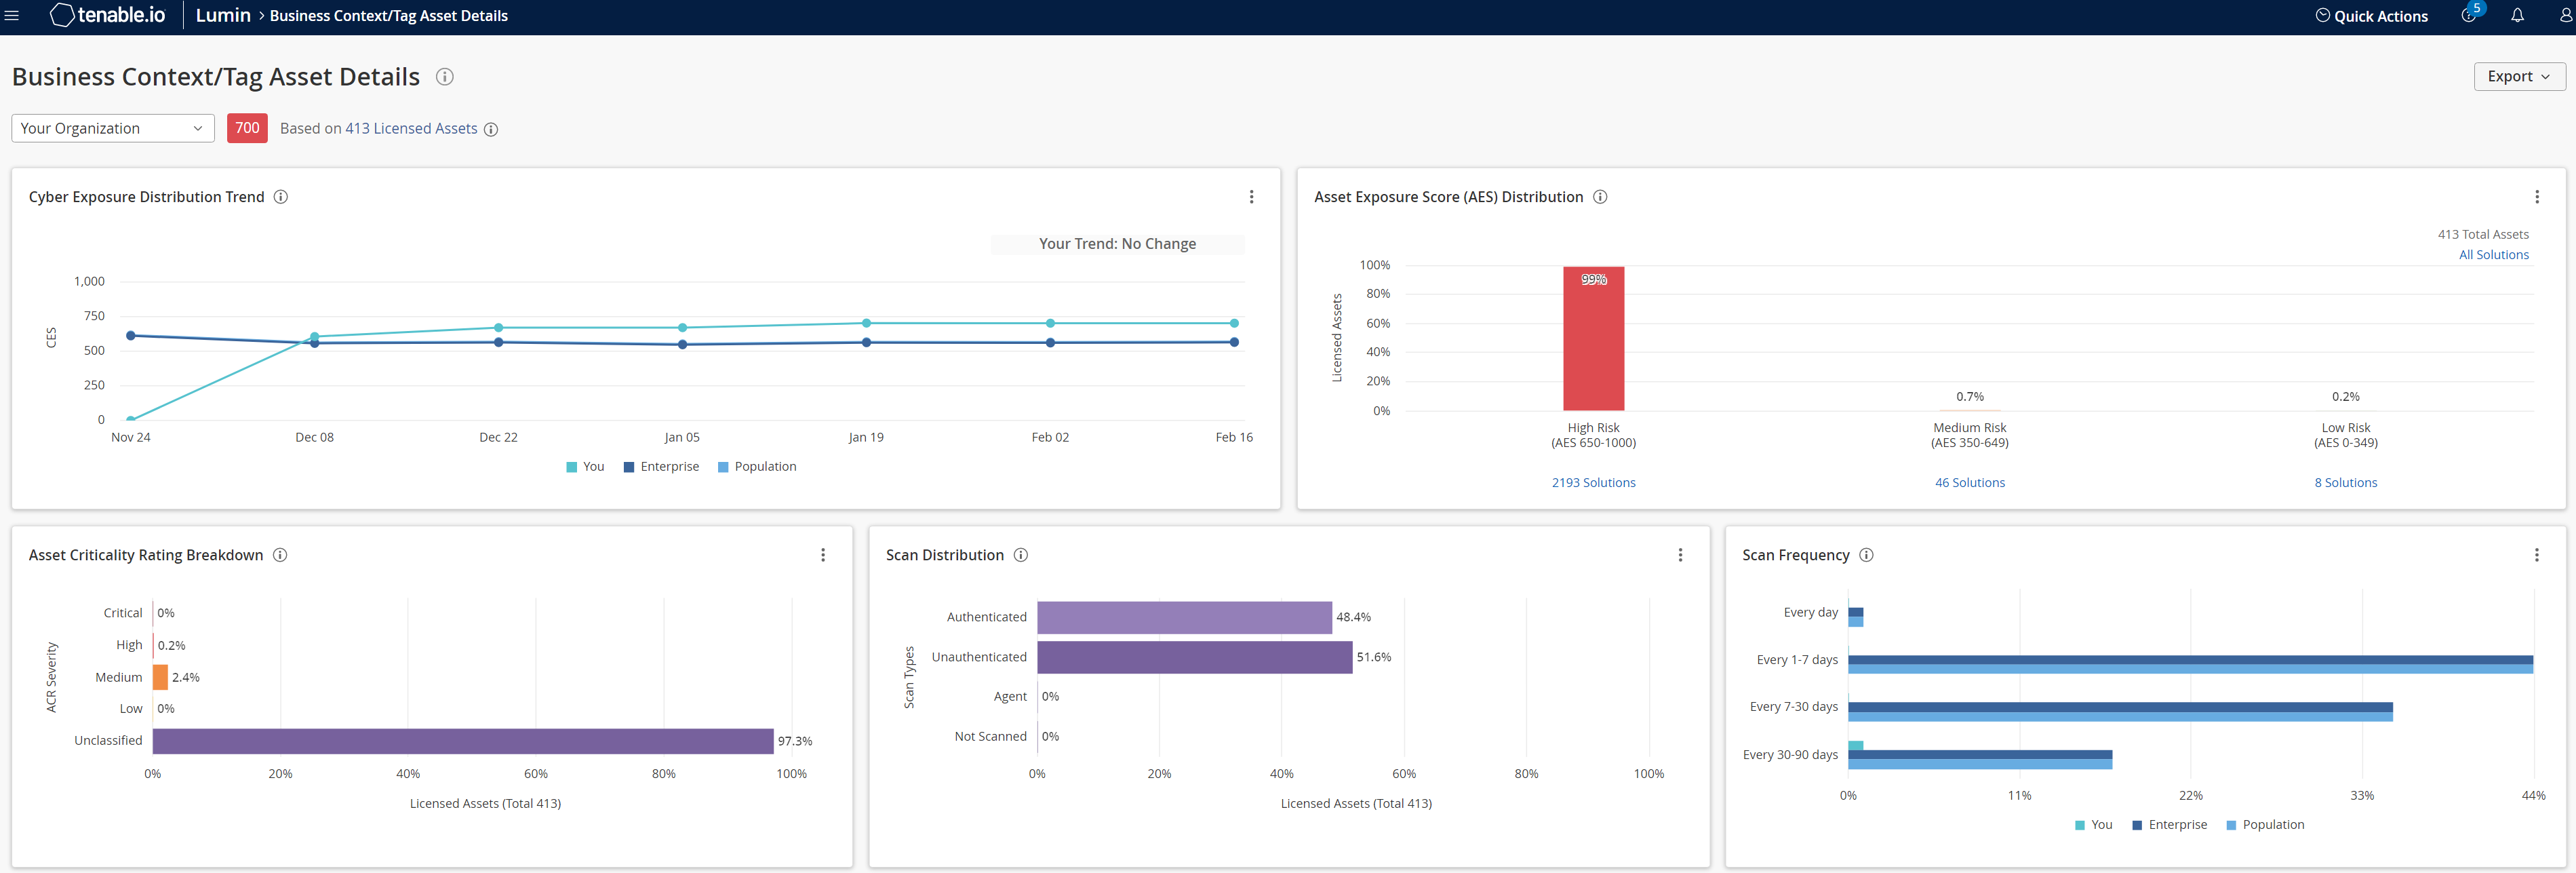
View Business Context/Tag Asset Details
The following is not supported in Tenable FedRAMP Moderate environments. For more information, see the Tenable FedRAMP Product Offering.
Required Additional License: Tenable One / Tenable Lumin
Required User Role: Basic, Scan Operator, Standard, Scan Manager, or Administrator
You can use this page to view details about assets with a specific business context tag.
Before you begin:
- Add tags to assets, as described in Add a Tag to an Asset.
To view business context tag asset details:
-
In the upper-left corner, click the
 button.
 The left navigation plane appears.
- In the left navigation plane, click Business Context.
The Business Context/Tag Asset Details page appears.
-
(Optional) To change the tag filter applied to the page, in the upper left corner, select a tag from the drop-down list.
Tenable Lumin filters the page by the tag you selected.
Note: All Tenable Lumin data reflects all assets within the organization's Tenable One Vulnerability Management instance.
| Section or Widget | Timeframe | Assets | Action |
|---|---|---|---|
| Tag summary | All time | Licensed and unlicensed assets with the tag applied |
|
| Cyber Exposure Score Trend
How has the overall risk for this business context changed over time? |
Past 90 days at each point on the graph, recalculated daily | Licensed assets with the tag applied |
This widget graphs the increases and decreases to your tag-specific CES compared to the average organization-wide CES for Tenable customers in your Salesforce industry and the larger population. Note: Newly added tags may take up to 14 days before displaying CES trending information.
|
| Asset Distribution by Asset Exposure Score (AES)
How exposed are my assets? |
Past 90 days | Licensed assets with the tag applied and shared with your user account via access groups |
This widget summarizes the number of vulnerabilities in each AES category.
|
| Asset Criticality Rating Breakdown
How critical are my assets? |
Past 90 days | Licensed and unlicensed assets with the tag applied |
This widget visualizes the percentage of your assets in each ACR category.
|
|
Asset Scan Distribution What percentage of your assets are scanned with different methods? |
Past 90 days | Licensed and unlicensed assets with the tag applied |
This widget summarizes your asset scan distribution during the past 90 days. Authenticated Scans are run by a non-agent scanner with credentialed scanning configured. Agent Scans are run by agent scanners. All other scans are Unauthenticated Scans.
|
|
Asset Scan Frequency How often are you scanning your assets? |
Past 90 days | Licensed and unlicensed assets with the tag applied |
This widget visualizes the percentage of assets scanned on your network during periods in the past 90 days, compared to others in your Salesforce industry and the population.
|
 button. Click the desired filter.