Navigate the Console
The Console is the central control panel for Tenable. The Console provides a comprehensive interface for managing and assessing the security posture of your entire cloud environment. This article guides you through the primary navigation elements to help you find what you need.
Log In to Tenable One AI Exposure
To log in to AI Exposure:
- In a supported browser, navigate to https://cloud.tenable.com/. The login page appears.
- Type your Username and Password credentials.
- Click Login. The Workspace page appears.
-
Click the AI Exposure tile.
The AI Exposure interface appears.
Left-Hand Navigation Menu
When you log into the Console, the Dashboard page appears. From here, you can investigate potential risks in your environment via Dashboard widgets, or use the left-hand navigation menu to go to relevant areas of the product.
If you're an Administrator user, you will also see the Settings menu.
| Menu Item | Description |
|---|---|
| Dashboards | Comprehensive overview of AI activity across your organization. It lists the active users, AI agents, a trend of AI activity and findings. |
| Explore | Centralized asset view of all cloud resources identified by AI Exposure, along with additional tools to analyze and investigate security data, query permissions, review activity logs, and identify anomalous behavior. |
| Risks | Assess and prioritize security risks, including findings, activity detections, and activity issues. |
| Policies | Define and enforce automated guardrails for identities, resources, preventing unauthorized AI activity across your environment. |
In-Product Help
Access in-app help directly from the Console. Product documentation is accessible both via:
- Search
- Contextual help links

To access the full documentation site, click the Docs portal link at the top of the slideout panel.
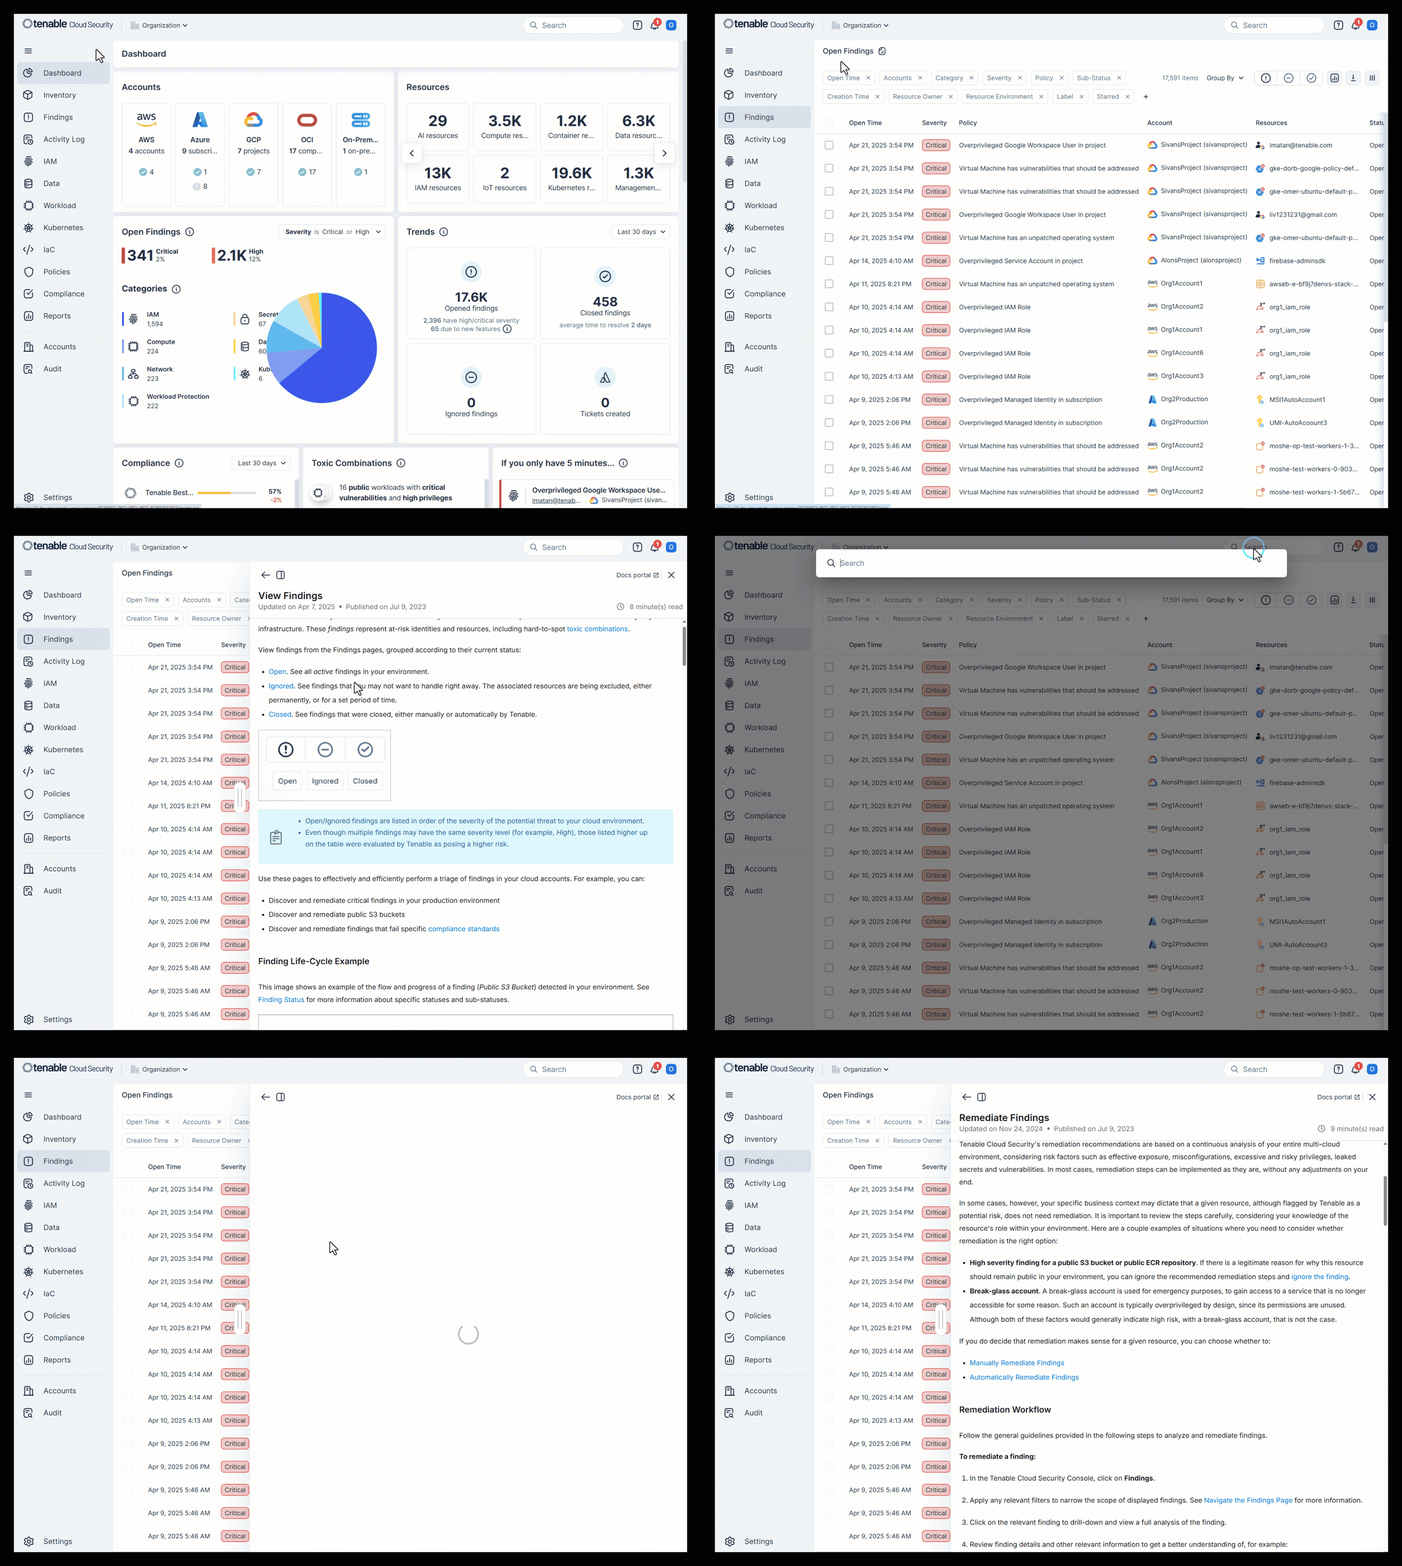
Help Tools
Click the question mark icon at the top right of the Console to access various help tools.
- Release Notes — Descriptions of the latest features and improvements added to AI Exposure in the last release. Check this frequently for updates. See Release Notes.
- Documentation — Comprehensive product documentation that helps you find answers to your technical questions and learn how to use AI Exposure.
- API Explorer — Use GraphiQL, an in-browser tool, to write, validate, and test GraphQL queries. See API to learn more.
- Feedback — Submit feedback to the AI Exposure product team directly from the Console.
- Contact Us — See Contact Support.
User Profile
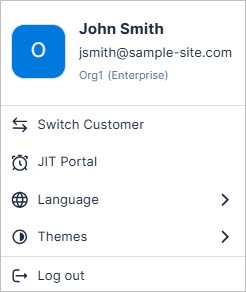
Click the icon at the top right of the Console to open your user profile. From here you can perform a variety of actions:
- See user details:
- User name / email address
- Company/organization name
- License type
- Customer ID. Used to register to the Tenable Community. See Contact Support for more information.
- Navigation:
- [JIT users only] Go to JIT Portal / Console. If you have access to both the AI Exposure Console and the JIT Portal, you can easily navigate back and forth between them.
- [Multi-tenant only] Switch Customer to view data for a different organization.
- Language
- English
- Japanese
- Themes
- Light Mode
- Dark Mode
- System
- Log out
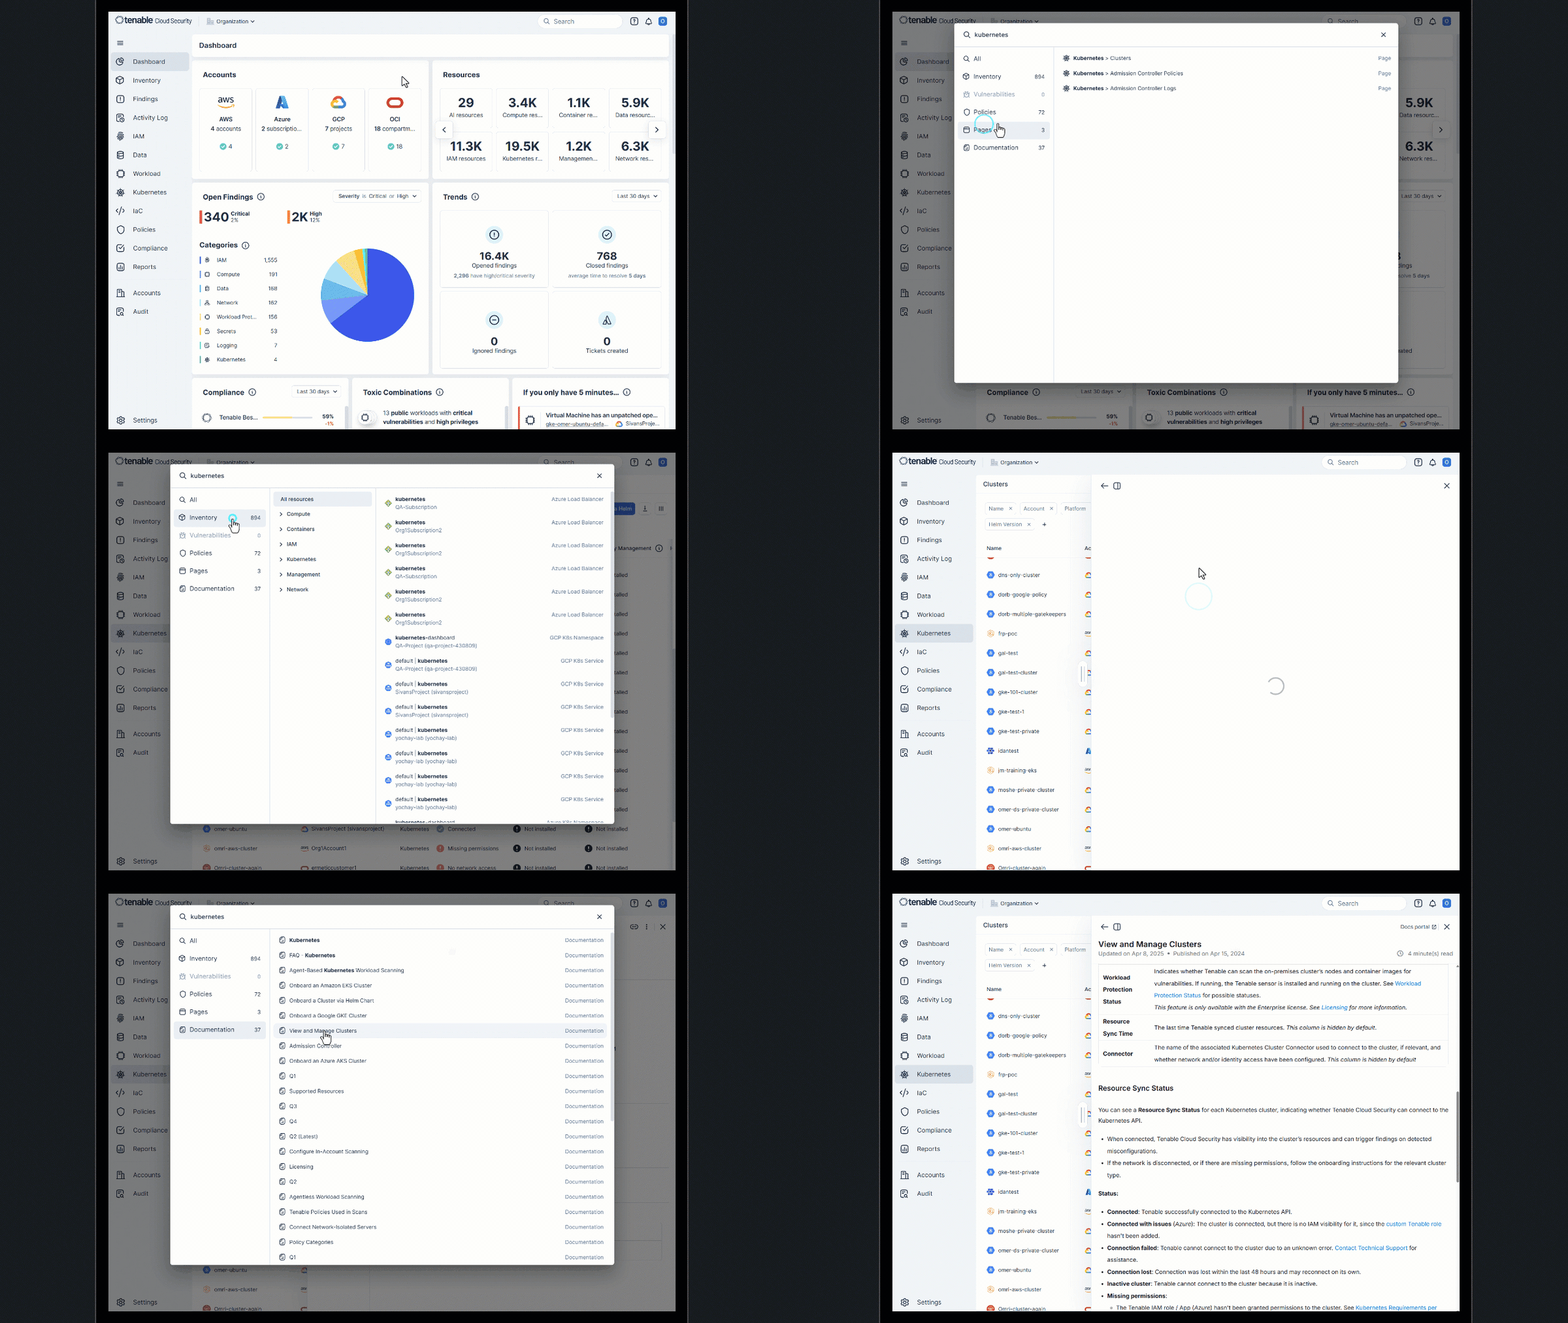
Search across the Console
Use the global search to find resources (Inventory), vulnerabilities, policies, pages, and documentation across your environment, providing a single, streamlined way to navigate and find what you need.
- The search bar appears at the top right of the AI Exposure Console, regardless of which page you're on.
- Click Ctrl + K to access via keyboard shortcut.
- (Optional) Select a scope in the account scope dropdown to limit the search to a subset of accounts.
- Inventory results are divided by category (for example, AI or IAM) across your organization.
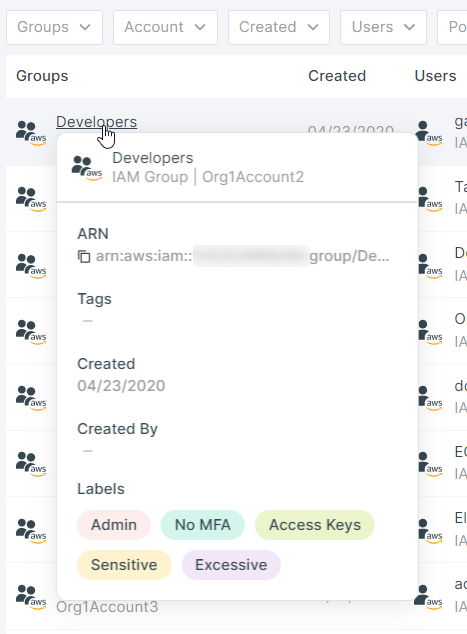
At-a-Glance Resource Profile View
Hover over any resource name in the Inventory, access graph (permission mapping), Activity Log, or Findings page to see a mini profile view that contains a selection of the most important information about the resource. This allows you to learn more about the resource without context-switching to another page to view this information.
Color-Coded Risk Severity
Throughout the Console, different colors/icons are used to indicate the various risk severity levels that resources and findings pose to your organization. The following table maps these colors to their respective severity levels, and describes their implications within your cloud environment.
| COLOR | ICON | STATUS | DESCRIPTION | EXAMPLE |
|---|---|---|---|---|

|

|
Critical | Immediate action required | Administrative user with permissions to sensitive data, which aren't in use. |

|

|
High | Handle as soon as possible | Non-admin user with permissions to sensitive data, which aren't in use. |

|
|
Medium | Potential risk | User with permissions to sensitive resources such as bucket lists, but without permissions to read the bucket contents. |

|

|
Low | Monitor for escalation | User with limited use of assigned permissions. |
|
|
|
Informational | Useful information | A new GCP project was added to your organization. |

|
N/A | In Compliance (Compliance only) | No action necessary | No excessive permissions detected. Policy Rules and best practices met. |