Tenable Web App Scanning Dashboard
The default Web Applications Scanning dashboard shows the data that Tenable Web App Scanning collects.
Required User Role: Basic User, Scan Operator, Standard User, Scan Manager, or Administrator
Tenable Web App Scanning uses several metrics to help you assess your risk:

Tenable Web App Scanning Global Applications Health
The following tables describe the sections and widgets shown in the Global Applications Health section of the Web Applications Scanning dashboard. You can view details about the data in a widget by clicking the widget. The Global Applications Health widget in the left panel shows information for Total Apps, Vulnerabilities, and Unscanned applications:
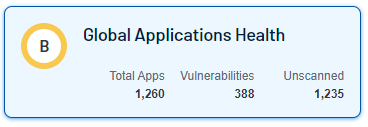
The outer circle of the dashboard ring chart tracks the Asset Exposure Score (AES) of four of your scanned applications and a small Other segment of the remaining applications. You can click this segment to see the next four of your applications and their related details. Each segment's color changes along with the current AES score. The center of the dashboard ring chart shows your overall Cyber Exposure Score (CES) score and the color changes along with your current CES grade. For more information on your application details, see Findings.
For a demonstration on how Tenable calculates your CES, see the following video:
|
Widget |
Description |
|---|---|
|
Overall Score |
The number of findings Tenable Web App Scanning has discovered. Tenable Web App Scanning categorizes the findings by severity (Critical and High). For information about vulnerability ratings and the severity metrics Tenable uses to analyze risk, see Severity vs. VPR in the Tenable Vulnerability Management User Guide. |
| Web Applications Scanned | The number of applications scanned over time. |
| Incomplete Scans | The number of incomplete scans in the past 90 days. |
| Non-Authenticated Scans | The number of non-authenticated scans in the past 90 days. |
Tenable Web App Scanning calculates a dynamic AES for each application on your network to represent the application's relative exposure as an integer between zero and 1000. A higher AES indicates higher exposure.
Tenable Web App Scanning calculates AES based on the current ACR (Tenable-provided) and the VPRs associated with the application.
| AES Category | AES Range |
|---|---|
| High | 650 to 1000 |
| Medium | 350 to 649 |
| Low |
0 to 349 |
Note: Asset Exposure Score (AES) is only available in Tenable Web App Scanning for customers with a valid Lumin license.
The list of top contributing factors in the right side of the user interface shows what severity classifications of scanned applications are present for your Tenable Web App Scanning instance. These items contribute to your overall scores. Investigate and address the following to help reduce your score:
- % of applications have critical, high, medium, or low risk
- % of applications have critical, high, medium, or low risk
- You have (xyz amount) application vulnerabilities
- You have an average of (xyz amount) vulnerabilities per application
Note:Tenable Web App Scanning only shows four items in the list. The first two always show the two highest severity risks applications available. The last two contributing factor items are always present in the dashboard.
Manage Your Application Exposure
Remediation metrics help with addressing and resolving critical vulnerabilities and unauthenticated scans across your web applications.
|
Widget |
Description |
|---|---|
|
Fix Critical Vulnerabilities |
The number of findings Tenable Web App Scanning has discovered. Tenable Web App Scanning categorizes the findings by severity (Critical and High). For information about vulnerability ratings and the severity metrics Tenable uses to analyze risk, see Severity vs. VPR in the Tenable Vulnerability Management User Guide. |
| Address Incomplete Scans |
The number of non-authenticated scans in the past 90 days. Note: Incomplete scans are scans whose status is either aborted, canceled, or partial failure. |
| Address Non-Authenticated Scans | The number of non-authenticated scans in the past 90 days. |
| Fix OWASP Top 10 Vulnerabilities | Uses a query filter to list the OWASP top ten vulnerabilities. |
Prevention metrics help with early identification and mitigation of potential vulnerabilities from unscanned applications and total findings in your scanned applications.
|
Widget |
Description |
|---|---|
| Scan Unscanned Web Applications | Number of incomplete scans in the past 90 days. |
| Investigate Total Findings | Number of applications scanned over time. |
Tenable Web App Scanning Statistics
The following table describes the widgets shown in the Statistics section of the Web Applications Scanning dashboard. You can view details about the data in a widget by clicking the widget.
|
Widget |
Description |
|---|---|
|
Findings |
Number of findings Tenable Web App Scanning has discovered. Tenable Web App Scanning categorizes the findings by severity (Critical and High). For information about vulnerability ratings and the severity metrics Tenable uses to analyze risk, see Severity vs. VPR in the Tenable Vulnerability Management User Guide. |
| Web Assets Scanned | Number of assets scanned over time. |
| Incomplete Scans | Number of incomplete scans in the past 90 days. |
| Non- Authenticated Scans | Number of non-authenticated scans in the past 90 days. |
Next Steps
To view scores and details of specific applications, see the following pages: