Tenable OT Agent Interface
Tenable OT Agents are software components you can install on remote Windows machines to actively query and discover OT Security assets in environments where sensor installation is not possible or practical.
OT Agents leverage active queries to scan duplicated and active query networks listed under Monitored Networks. This allows the agent, running on a Windows-based gateway, an engineering workstation, or Human-Machine Interface (HMI) to identify critical OT / IoT, and embedded devices on the network.
To download and install the Tenable OT Agent, follow the steps in the OT Agents documentation.
Access the Agent from the System Tray
Tenable OT Agent runs in the background and is accessible from the Windows system tray.
In the Windows taskbar, click the system tray icon (bottom-right corner of the screen).
Click the Tenable OT Agent icon.
A context menu appears showing the current agent status and the following options:

Agent Status — Displays the current state of the agent (for example, Idle or Active).
Control Panel — Opens the Control Panel dashboard.
Scans — Opens the Scans page.
Executions — Opens the Executions page.
System Log — Opens the System Log page.
Settings — Opens the Settings page.
Version — Displays the installed agent version.
Click any menu item to navigate directly to that section of the agent interface.
Control Panel
The Control Panel is the main dashboard in Tenable OT Agent. It gives you a real-time summary of agent status, recent scan activity, and discovered assets for the currently selected area.
To access Control Panel:
In the left navigation menu, click Control Panel.
The Control Panel page appears.

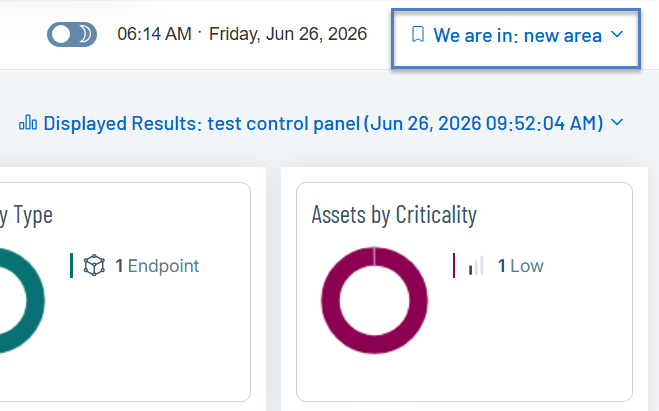
The dashboard loads results from the most recent scan for the active area. The current area and snapshot timestamp appear in the top-right corner.
If there are no scans, the Control Panel page shows options to upload scan files or pair an ICP.

Dashboard
The top row of the Control Panel page displays the following widgets:
Agent Status shows whether the OT Security agent is active or inactive, along with the timestamp of its last status change. An Active status means the agent is running and available to perform scans.
Scan Duration shows how long the most recent scan took to complete and when it finished. This helps you assess scan performance over time.
Assets by Type shows a donut chart of discovered assets by category (for example, Endpoints, Controllers). Each segment is labeled with a count.
Assets by Criticality shows a donut chart of discovered assets by their criticality level (for example, Low, Medium, High, Critical).
Discovered Assets shows the total number of assets found in the last scan.
Next Scan shows when the next scheduled scan is set to run. If no recurrence is configured, this displays as "Undefined."
Available Scans
The Available Scans table lists all scans configured for the current area and includes the following details:
| Column | Description |
|---|---|
| Scan Name | The name assigned to the scan. |
| Networks | The IP range or subnet the scan targets. |
| Generated By | The user who created the scan. |
| Status | The status of the scan, whether Active or Inactive. |
| Recurrence | Toggle indicating whether the scan runs on a schedule. |
| Credentials | The credential profile used for the scan (for example, SNMP V1). |
| See All Scans | To view all scans across areas, click See All Scans in the top-right corner of the table. |
| To access options for a specific scan such as Run Now or Abort), click the |
Switching Network Areas
The area selector in the top-right header ("We are in: area") controls which area's data is displayed. Click it to switch to a different area. The Control Panel, scan list, and asset summaries update to reflect the selected area.
Scans
The Scans page lists all scans configured for the currently selected area. You can use the Scans page to upload scan files from the ICP. View, run, and group scans from this page.
To access the Scans page:
In the left navigation menu, click Scans.
The Scans page appears.

The Scans page includes the following details:
| Column | Description |
|---|---|
| Search and Filter | Use the Search bar to find scans by name. Click + Add Filter and select filter criteria from the drop-down list. |
| Group By | Click Group By to organize the scan list by a specific attribute, such as status or network. |
| Scan Name | The name assigned to the scan. |
| Networks | The IP range or subnet the scan targets. |
| Generated By | The user who created the scan. |
| Status | The status of the scan, whether Active or Inactive. |
| Recurrence | A toggle indicating whether the scan runs on a schedule. |
| Credentials | The credential profile used for the scan (for example, SNMP V1). |
| Export | Click the  button to export the scans data to a CSV format. button to export the scans data to a CSV format. |
| Displayed Columns | Click the |
Upload Scan Files
To import the scan configuration or the OTD Scan file from the ICP, click Upload Scan File(s) in the top-right corner and select the file to upload.
To create OTD Scans, see Define the OT Discovery Scan. The OTD scan file uses the .otds extension.
Run Scans
To run scans:
In the Scans table, do one of the following:
Select the required scan you want to run.
Tenable OT Agent enables the Actions menu.
Click Run Now.
Tenable OT Agent runs the scan. The status changes to Running.
Executions
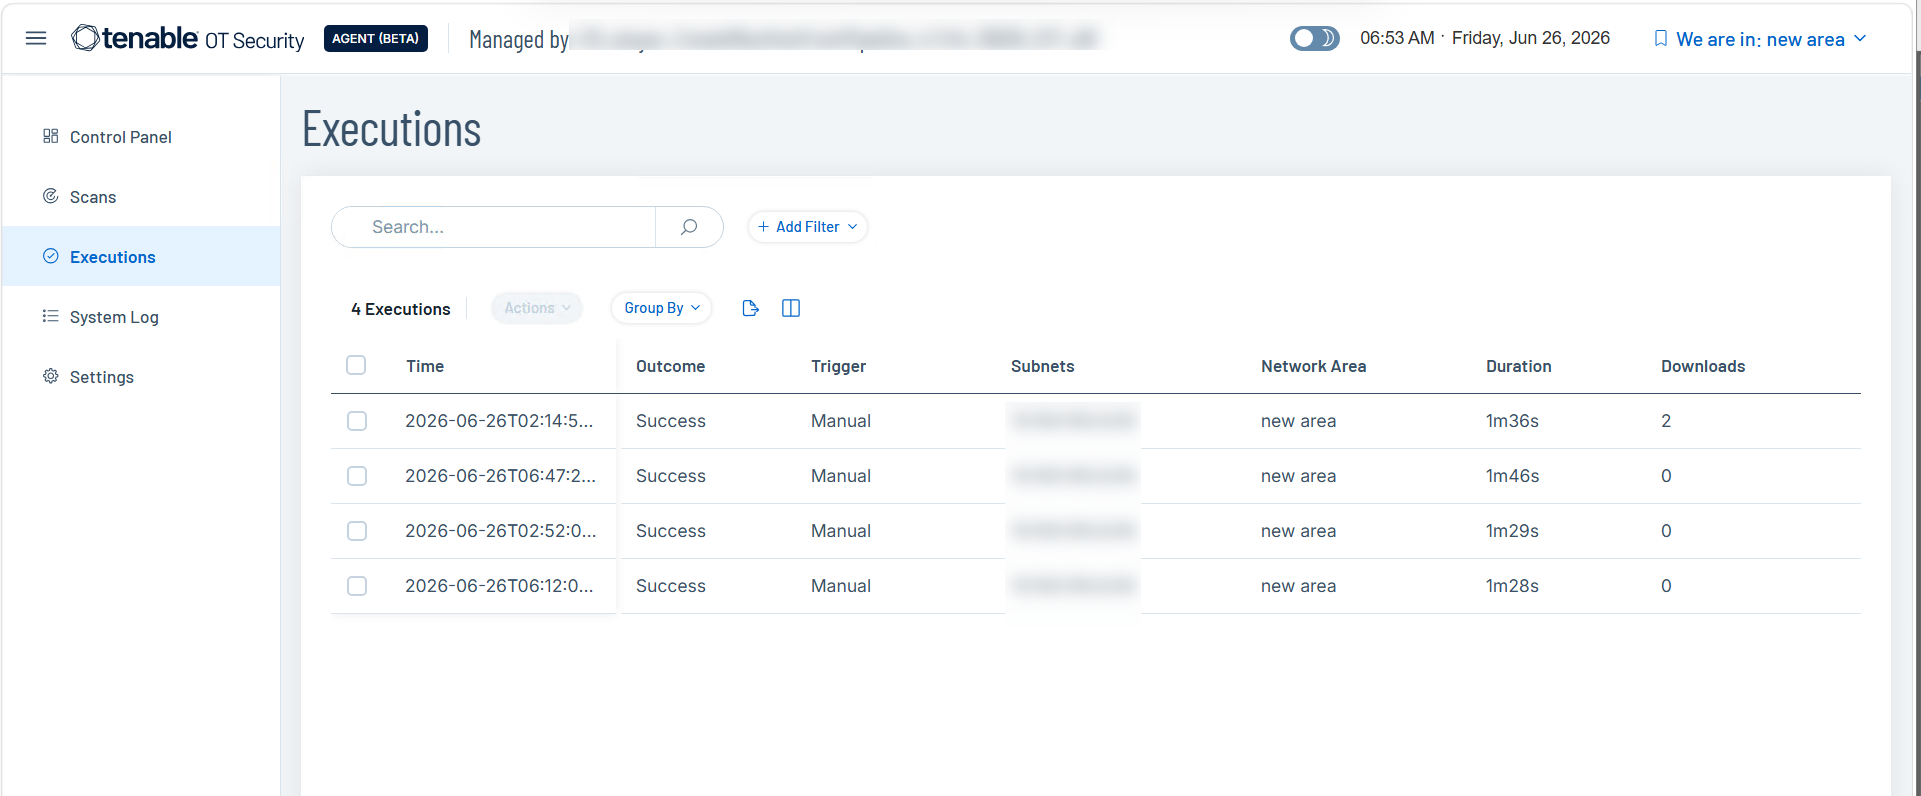
The Executions page shows a log of all scan runs for the currently selected network area. Use it to review past scan outcomes, duration of the scans, and to download results.
To access the Executions page:
In the left navigation menu, click Executions.
The Executions page appears.
The Executions table includes the following tables:
| Column | Description |
|---|---|
| Search and Filter | Use the Search bar to find executions by keyword. Click + Add Filter and select filter criteria from the drop-down list. |
| Group By | Click Group By to organize executions by a specific attribute, such as outcome or network area. |
| Time | The date and time the execution started. |
| Outcome | The result of the execution. For example, Success or Failed. |
| Trigger | How the scan was initiated whether Manual or Scheduled. |
| Subnets | The IP range scanned during this execution. |
| Network Area | The network area specified in the scan configuration file. |
| Duration | The time taken to complete the scan. |
| Downloads | The number of times the results file was downloaded. |
Download Scan Results
Download scan results to upload to ICP for analysis.
To download scan results:
In the Executions table, do one of the following:
Select the scan outcome for which you want to download the results file.
Tenable OT Agent enables the Actions menu, which includes the Download Results File option.
Right-click the scan outcome for which you want to download the results file.
Click Download Results File.
Tenable OT Agent downloads the results file. Upload this file to the ICP for further analysis. The results file uses the .otdr extension. See Upload Results.
System Log
The System Log page includes a chronological record of activity inTenable OT Agent. It captures system-generated events such as scan starts and completions, file downloads, and area changes giving you a complete set of actions taken within the product.
To access the System Log page:
In the left navigation menu, click System Log.
The System Log page appears.

The System Log table includes the following details:
| Column | Description |
|---|---|
| Search and Filter | Use the Search bar to find entries by keyword. Click + Add Filter and select filter criteria from the drop-down list. |
| Group By | Click Group By to organize log entries by a specific attribute, such as entry ID or event type. |
| Event | A description of the activity. For example, a scan complete, a manual scan start, downloaded scan results, or a network area change. |
| Entry ID | The source of the event. |
| Export | Click the button to export the scans data to a CSV format. |
| Displayed Columns | Click the |
Settings
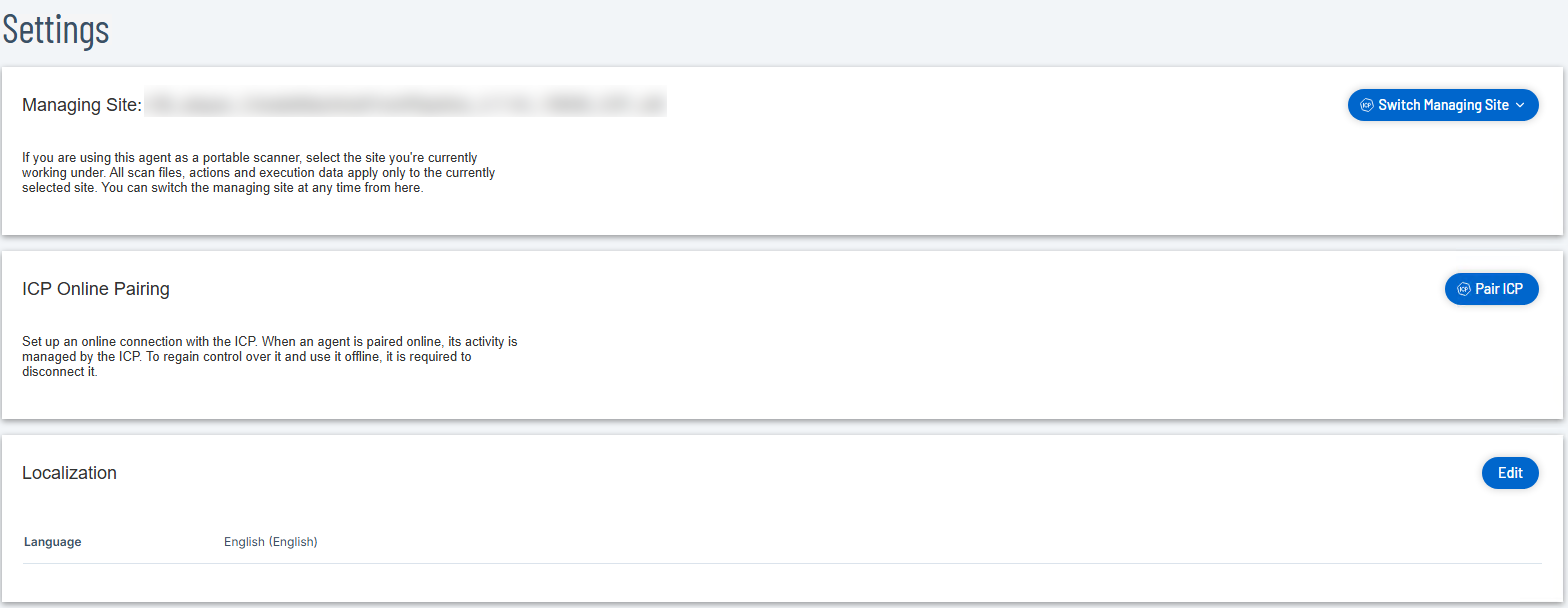
Use the Settings page to configure the managing site, ICP connection, and localization preferences for the Tenable OT Agent.
Manage Site
Displays the site the agent is currently associated with. All scan files, actions, and execution data are scoped to the selected site. If you are using the agent as a portable scanner, select the site you are currently working under before running scans.
Click Switch Managing Site to change the active site. You can switch the managing site at any time from this setting.
ICP Online Pairing
Set up an online connection between the Tenable OT Agent and the ICP. When paired online, the ICP manages the agent's activity.
Click Pair ICP to initiate the online pairing process. To use the agent offline after pairing, you must first disconnect it from the ICP.
To pair using a pairing key:
Click Pair ICP.
The ICP Pairing Configuration dialog opens.
Select Pair Using Pairing Key.
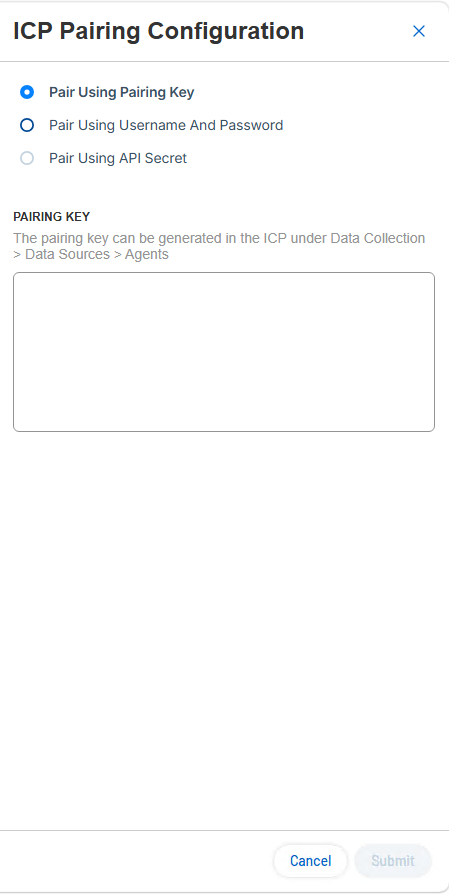
In the ICP, go to Data Collection > Data Sources > Agents and generate a pairing key.
Paste the pairing key into the Pairing Key box.
Click Submit.
To pair using a username and password:
Click Pair ICP.
The ICP Pairing Configuration dialog opens.
Select Pair Using Username And Password.

In the Hostname/IP of the ICP box, type the hostname or IP address of the ICP.
In the Username box, provide your ICP username.
In the Password box, provide your ICP password. To keep an existing saved password, leave this field empty.
In the ICP Certificate Fingerprint box, provide the certificate fingerprint for the ICP.
You can find the fingerprint in the ICP under Settings > System Configuration > Certificates. For more information, see Certificates.
Click Submit.
To pair using an API secret:
Click Pair ICP.
The ICP Pairing Configuration dialog opens.
Select Pair Using API Secret.

In the Hostname/IP of the ICP box, provide the hostname or IP address of the ICP.
In the API Secret box, enter the API key. To keep an existing saved API key, leave this field empty.
You can generate the API key in the ICP under Settings > System Configuration > API Keys. For more information, see Generate API Keys.
In the ICP Certificate Fingerprint box, enter the certificate fingerprint for the ICP.
You can get the fingerprint in the ICP under Settings > System Configuration > Certificates. For more information, see Certificates.
Click Submit.
Localization
Displays the current language setting for the interface. The default is English (English).
To change the display language:
In the Localization section, click Edit.
Select your preferred language.
Click Save.