Detectify Connector
The following is not supported in Tenable FedRAMP Moderate environments. For more information, see the Tenable FedRAMP Product Offering.
The following steps allow you to configure this connector for use with Tenable Exposure Management from start to finish.
Connector Details
| Details | Description |
|---|---|
|
Supported products |
|
|
Category |
DAST |
|
Ingested data |
Assets and Findings |
|
Ingested Asset Classes |
Web Application |
|
Integration type |
UNI directional (data is transferred from the Connector to Tenable Exposure Management in one direction) |
|
Supported version and type |
SaaS (latest) |
Prerequisites and User Permissions
Before you begin configuring the connector, make sure to:
-
Confirm that you have a Detectify Enterprise account.
Generate a Detectify API Key
-
Log in to the Detectify platform.
-
Click your account name in the upper-left corner of the screen.
-
Select Account Settings.
-
Navigate to the API Keys tab.
-
Click Generate API Key.
-
If this is your first key, you’ll see an empty API key section. If you already have keys, they will appear in a list.
-
Enter a name and optional description for the API key.
-
Click Generate API Key.
-
Copy the API Key to a safe location. You need it to configure the connector.
-
Click Save.
-
In the API Key Settings section, ensure the following permissions are enabled:
-
Allow listing domains
-
Allow reading vulnerabilities
-
-
Click Save changes to apply the settings.
Add a Connector
To add a new connector:
-
In the left navigation menu, click Connectors.
The Connectors page appears.

-
In the upper-right corner, click
 Add new connector.
The Connector Library page appears.

-
In the search box, type the name of the connector.
-
On the tile for the connector, click Connect.
The connector configuration options appear.
Configure the Connector
To configure the connector:
-
(Optional) In the Connector's Name text box, type a descriptive name for the connector.
-
(Optional) To use a preconfigured on-prem connector to connect to this connector, from the Gateway drop-down, select the on-prem connector you want to use for the connector. Otherwise, select Don't use gateway.
Note: For information about configuring a gateway, see Tenable On-Prem Connector. -
In the API Keytext box, paste the API key you generated earlier.
-
In the Data pulling configuration section, you can configure dynamic settings specific to the connector.
-
Select the relevant fetching options for your integration.
-
In the Asset Retention text box, type the number of days after which you want assets to be removed from Tenable Exposure Management. If an asset has not been detected or updated within the specified number of days, it is automatically removed from the application, ensuring your asset inventory is current and relevant.
Tip: For more information, see Asset Retention.
-
-
In the Test connectivity section, click the Test Connectivity button to verify that Tenable Exposure Management can connect to your connector instance.
-
A successful connectivity test confirms that the platform can connect to the connector instance. It does not, however, guarantee that the synchronization process will succeed, as additional syncing or processing issues may arise.
-
If the connectivity test fails, an error message with details about the issue appears. Click Show tests for more information about the exact error.

-
-
In the Connector scheduling section, configure the time and day(s) on which you want connector syncs to occur.
Tip: For more information, see Connector Scheduling. -
Click Create. Tenable Exposure Management begins syncing the connector. The sync can take some time to complete.
-
To confirm the sync is complete, do the following:
-
Navigate to the Connectors page and monitor the connector's status. Sync is complete once the connector status is Connected.
-
View the sync logs for the connector to monitor the logs for a successful connection.
-
Detectify in Tenable Exposure Management
Locate Connector Assets in Tenable Exposure Management
As the connector discovers assets, Tenable Exposure Management ingests those devices for reporting.
To view assets by connector:
-
In Tenable Exposure Management, navigate to the Assets page.
-
In the Filters section, under 3rd Party Connectors, click the connector name for which you want to view assets.

The asset list updates to show only assets from the selected connector.
-
Click on any asset to view Asset Details.
Locate Connector Weaknesses in Tenable Exposure Management
As the connector discovers weaknesses, Tenable Exposure Management ingests those weaknesses for reporting.
To view weaknesses by connector:
-
In Tenable Exposure Management, navigate to the Weaknesses page.
-
In the Filters section, under 3rd Party Connectors, click the connector name for which you want to view weaknesses.
The weaknesses list updates to show only weaknesses from the selected connector.
-
Click on any weakness to view Weakness Details.
Locate Connector Findings in Tenable Exposure Management
As the connector discovers individual findings, Tenable Exposure Management ingests those findings for reporting.
To view findings by connector:
-
In Tenable Exposure Management, navigate to the Findings page.
-
In the Filters section, under 3rd Party Connectors, click the connector name for which you want to view findings.
The findings list updates to show only assets from the selected connector.
-
Click on any asset to view Finding Details.
Data Mapping
Tenable Exposure Management integrates with the connector via API to retrieve relevant weakness and asset data, which is then mapped into the Tenable Exposure Management system. The following tables outline how fields and their values are mapped from the connector to Tenable Exposure Management.
Web Application Mapping
| Tenable Exposure Management Value |
Detectify Value |
|---|---|
| Unique Identifier | name |
| Asset - Name | name |
| Asset - First Observation Date | created |
| Asset - Last Observed At | last_seen |
| Asset - Webapp Homepage Screenshot Url | name |
|
Asset - External Tags |
domain_type |
| Asset Custom Attributes |
token added_by domain_type |
Finding Mapping
| Tenable Exposure Management UI Field |
Detectify Field |
|---|---|
| Unique Identifier | Asset unique id + uuid + Vulnerability unique id |
| Finding Name | title |
| CVEs | cwe |
| Severity Driver | score OR severity |
| Description | definition.description, definition.risk |
| First Seen |
created_at fallback: timestamp |
| Last seen (Observed) |
updated_at fallback: timestamp |
| Finding Custom Attributes |
location references detectify_tags cvss3_scoring cvss3_severity cvss2_scoring cvss2_severity owasp_year owasp_classification detectify_risk detectify_tags vector detectify_scan_profile_token detectify_asset_vulnerability_connection_uuid detectify_source detectify_scan_source detectify_details_page |
Finding Status Mapping
|
Tenable Exposure Management Status |
Detectify Status |
|---|---|
|
Active |
Active New Regression False Positive Accepted Risk |
|
Fixed |
Patched |
Note:For Detecitfy, Tenable Exposure Management uses the status field to determine finding status.
Finding Severity Mapping
|
Tenable Exposure Management Severity |
Detectify Score |
|---|---|
|
Critical |
CVSS: 9.0 - 10.0 Severity: Critical |
|
High |
CVSS: 7.0 - 8.9 Severity: High |
|
Medium |
CVSS: 4.0 - 6.9 Severity: Medium |
|
Low |
CVSS: 1-3.9 Severity:Low |
|
None |
CVSS:0 Severtity: empty |
Note:For Detectify, Tenable Exposure Management uses the score or severity field to determine severity.
Status Update Mechanisms
Every day, Tenable Exposure Management syncs with the vendor's platform to receive updates on existing findings and assets and to retrieve new ones (if any were added).
The table below describes how the status update mechanism works in the connector for findings and assets ingested into Tenable Exposure Management.
|
Update Type in Tenable Exposure Management |
Mechanism (When?) |
|---|---|
|
Archiving Assets |
|
|
Change a Finding status from "Active" to "Fixed" |
|
Uniqueness Criteria
Tenable Exposure Management uses defined uniqueness criteria to determine whether an ingested asset or finding should be recognized as a distinct record. These criteria help define how assets and findings are identified and counted from each connector.
Tip: For more information, see Asset Deduplication in Tenable Exposure Management
The uniqueness criteria for this connector are as follows:
|
Data |
Uniqueness Criteria |
|---|---|
|
Asset |
name |
|
Finding |
Asset unique id + uuid + Vulnerability unique id |
API Endpoints in Use
API version: v2.2.2
| Required Permissions | ||
|---|---|---|
|
https://api.detectify.com/rest/v2/assets/ |
Assets |
Allow listing domains |
|
https://api.detectify.com/rest/v2/assets/{domainToken}/subdomains/ |
Assets | Allow listing domains |
| https://api.detectify.com/rest/v2/vulnerabilities/ |
Findings Detection |
Allow reading vulnerabilities |
Data Validation
This section shows how to validate and compare data between Tenable Exposure Management and the Detectify platform.
Asset Data Validation
Objective: Ensure the number of scanned domains in Detectify aligns with the web applications displayed in Tenable Exposure Management.
In Detectify:
-
Navigate to the Surface Monitoring.
-
The assets list is displayed.

In Tenable Exposure Management:
-
Compare the total number of assets between Detectify and Tenable Exposure Management.
Expected outcome: The total numbers returned in Detectify and Tenable Exposure Management should match.
If an asset is not visible in Tenable Exposure Management, check the following conditions:
-
Archived based on the last observed date (last seen).
-
Archived because it did not return in the connector's next sync.
Tip: To learn more on how assets and findings change status, see Status Update Mechanisms.
Finding Data Validation
Objective: Ensure that the total number of findings between Detectify and Tenable Exposure Management is consistent.
In Detectify:
-
In Tenable Exposure Management, ingested vulnerabilities are aggregated and consolidated by uniqueness criteria to deduplicate the data. In Detectify, there is no vulnerability aggregation, and a unique vulnerability with the same URL can be listed several times (based on UUID). Therefore, when validating the data between the Detectify platform and Tenable Exposure Management, it is expected to observe a higher vulnerability count on Detectify than in Tenable Exposure Management.
-
Another source for vulnerabilities in Detectify is the Scan Reports findings, which is the latest report of each scan profile that reflects the current state of the domain. The data of the report is also ingested into Tenable Exposure Management in addition to the Vulnerabilities Report. However, the findings in the report aren't necessarily exclusive to the report as some of them can also appear in the Detectify Vulnerabilities Report.
-
The findings of the Scan Reports are aggregated and consolidated into Tenable Exposure Management in the same way as the vulnerabilities findings.
-
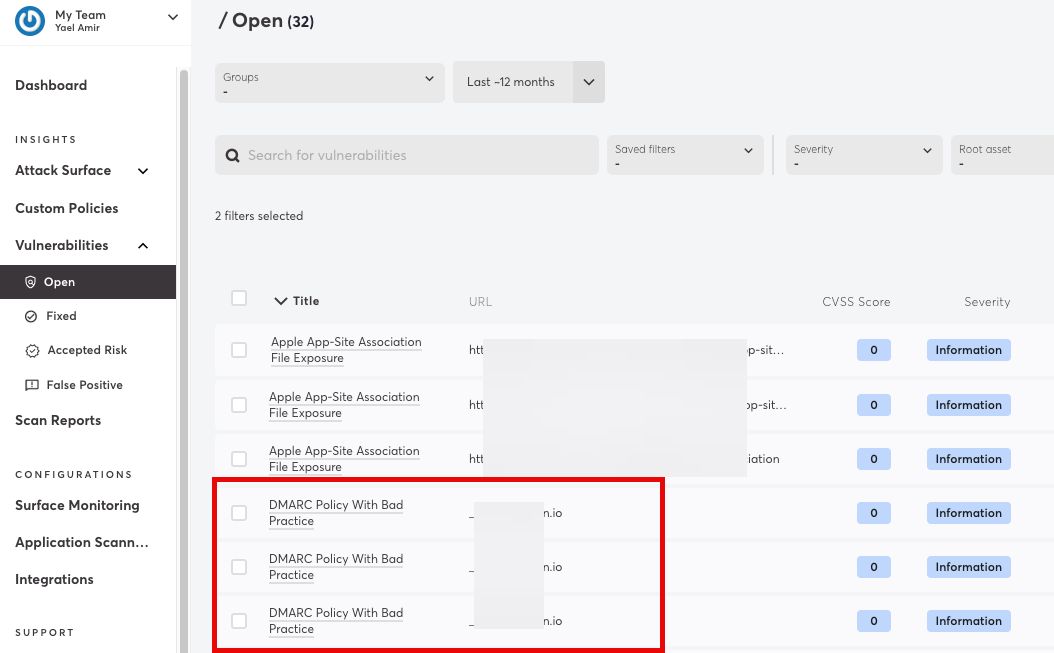
Vulnerability instances are identified by their title and the specific URL page.
-
If the same issue is found multiple times on the same URL, each instance is displayed separately in the Detectify UI.
-
Example: The vulnerability DMARC Policy With Bad Practice found three times on the same URL will appear as three separate entries in Detectify.
-
In Tenable Exposure Management:
-
Exposure Management deduplicates identical issues that occur on the same URL and aggregates them as a single finding.
-
In the above example, the three instances of DMARC Policy With Bad Practice on one URL will appear as one finding with that URL as the affected location.
-
Compare the total number of findings between Detectify and Tenable Exposure Management.
Expected outcome: The number of vulnerability instances in Tenable Exposure Management will generally be lower than the number displayed in Detectify, due to this aggregation logic.
If a finding is missing from Tenable Exposure Management or no longer active, check the following conditions:
-
The finding is marked as Fixed and appears under the Fixed state on the Findings screen.
-
The finding no longer appears because its related asset was archived.
Tip: To learn more on how assets and findings are archived or change status, see Status Update Mechanisms.