Platform Overview 101
This overview explains how Tenable One Cloud Exposure works: it builds an inventory of your resources, evaluates them against policies, and opens findings for you to act on. It also defines the core terms used throughout this guide.
Select any section to expand it.

 The Core Loop: Inventory, Policies, and Findings
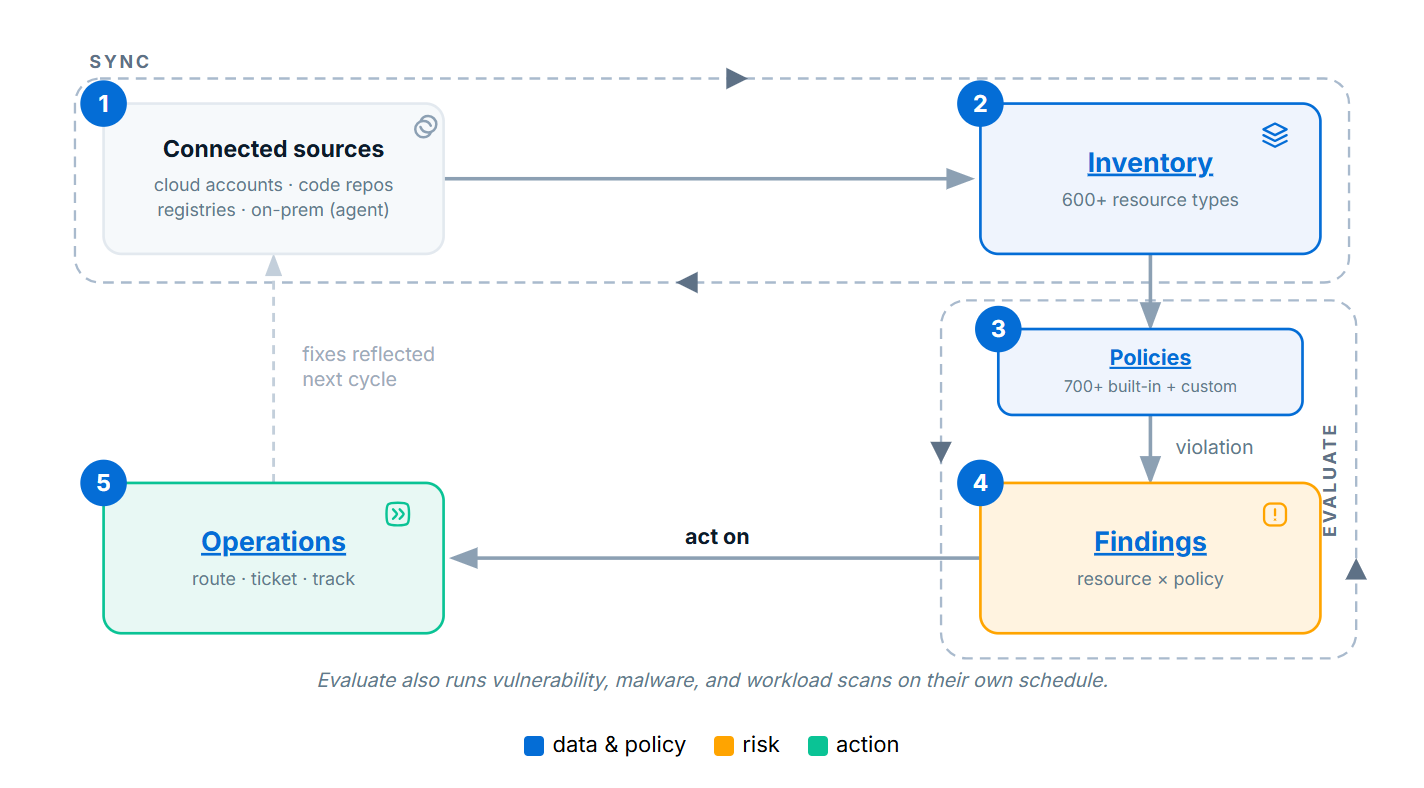
Three elements form the foundation of Cloud Exposure: the inventory, policies, and findings. Independent processes keep them current. A sync builds the inventory, the catalog of every resource across every connected source: cloud accounts (AWS, Azure, GCP, OCI, Alibaba), data stores such as Snowflake, code repositories, container registries, and on-premises resources via agent. A separate evaluation checks each resource against the policies that define what secure looks like. In parallel, agentless scans inspect your workloads and data for vulnerabilities, malware, and sensitive data on their own schedule. When a resource fails a policy or a scan surfaces a risk, the platform opens a finding. Acting on those findings, routing each to the right owner and tracking it to closure, is the primary operational work.
The core loop — follow the numbers, clockwise (tiles are clickable)
 Inventory
The inventory lives in the Explore section of the console. It catalogs 600+ resource types across supported cloud providers, with each resource carrying between 20 and 150 properties. Resources are the largest inventory, and the platform also tracks other inventory types, such as the vulnerabilities (CVEs) found on those resources.
Where a Resource's Data Comes From
| Layer | Source | Example |
|---|---|---|
| Synced | Cloud provider APIs | Region, resource name, configuration attributes |
| Calculated | Cloud Exposure | Internet exposure, effective permissions |
| Customer-set | Your team | Application name, owner, environment tags |
The Explorer is a query interface across every resource, property, and relationship the platform tracks. Build queries with joins, filters, and group-by to answer questions the prebuilt views cannot, then save any query as a custom policy in one step. Anything you can find in the Explorer, you can turn into a policy that watches for it continuously.
 Policies
 define what the platform checks. Cloud Exposure includes 700+ built-in policies covering IAM, compute, network, data, logging, and Kubernetes. When you enable a policy, the platform immediately evaluates all existing resources and opens findings for any violations.
700+ built-in policies across IAM, compute, network, data, logging, and Kubernetes. They carry severity levels (static or dynamic) and include remediation steps. Policy inheritance cascades down the scope tree: a policy enabled at the organization level applies to every account.
Build custom policies from a template, an Explorer query, or Rego. Define the violation condition, assign a severity level, and optionally write remediation guidance. Query-based policies use the same query builder as the Explorer, so you can run a query, refine it, and save it as a policy in one step. Rego policies check a single resource's own configuration, written in the Open Policy Agent (OPA) policy language.
Cloud Exposure checks your Infrastructure as Code (IaC) two ways, and they behave differently:
| Scan Type | When It Runs | What It Does |
|---|---|---|
| Code repository scan | Automatically, on every commit to the default branch, once a repo is connected. | Scans the IaC and opens an IaC finding for each misconfiguration. These findings live in the console (Risks → IaC Findings) alongside your cloud findings. |
| CI/CD & pull request scan | Inside your build pipeline, or on a pull request (GitHub, Azure DevOps). | Catches issues during development and can fail the build or block the merge on critical findings, before code reaches your cloud. Results also surface in the console within minutes. |
Cloud findings, by contrast, reflect already-deployed resources and never block or modify your cloud infrastructure.
 Findings
A finding identifies a specific violation: one resource × one policy. The finding takes its name from the policy that generated it. A single resource can have multiple findings if it violates multiple policies.
| Each Finding Contains | Details |
|---|---|
| Context | Whether the resource is internet-facing, holds sensitive data, and what environment it belongs to. Context raises severity dynamically. |
| Severity |
Most policies use dynamic severity: the same misconfiguration ranks higher on a public-facing production resource than on an isolated internal one. Others use static severity, fixed per policy. CriticalHighMediumLowInformational |
| Remediation steps | Specific instructions for resolving the violation. Built-in policies include these; custom policies let you write your own. |
| Status | Open, Ignored, or Closed, each with sub-statuses that explain the reason. See Finding Lifecycle below. |
 Finding Lifecycle
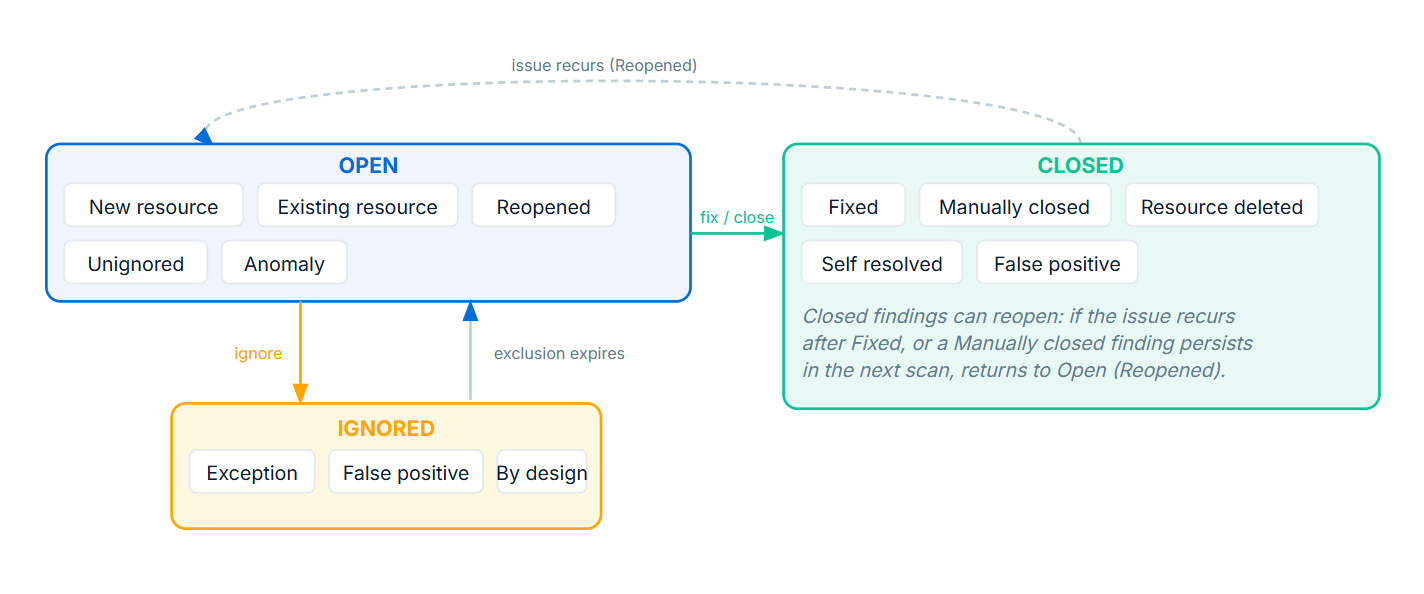
Findings progress through three top-level states. Each carries sub-statuses that explain why the finding has its current status.
Finding status flow
| Sub-Status | Meaning |
|---|---|
| New resource | The resource is new (created in the past week) and matched the policy for the first time. |
| Existing resource | The resource existed before but this is the first time it matched this policy. |
| Reopened | The issue was previously resolved or closed but is now active again. |
| Unignored | A suppression (exclusion) that was hiding this finding has expired, been updated, or been removed. |
| Anomaly | Tenable detected anomalous identity or resource activity. |
Managed through Exclusions: scoped suppression rules that accept, deprioritize, or adjust the severity of specific findings.
| Sub-Status | Meaning |
|---|---|
| Exception | Accepted temporarily while remediation is in progress. |
| False positive | The finding is verified as incorrect or irrelevant to your environment. |
| By design | The configuration is intentional and required for functionality. |
| Sub-Status | Meaning |
|---|---|
| Fixed | The resource no longer matches the policy, or was deleted per Tenable's recommendation. |
| Manually closed | A user closed the finding directly without waiting for the next sync cycle. |
| Resource deleted | The resource was deleted, but deletion was not the recommended remediation. |
| Self resolved | The resource state changed; the platform needs another evaluation cycle to confirm. |
| False positive | Tenable identified the finding as a false positive. |
 Threat Detection
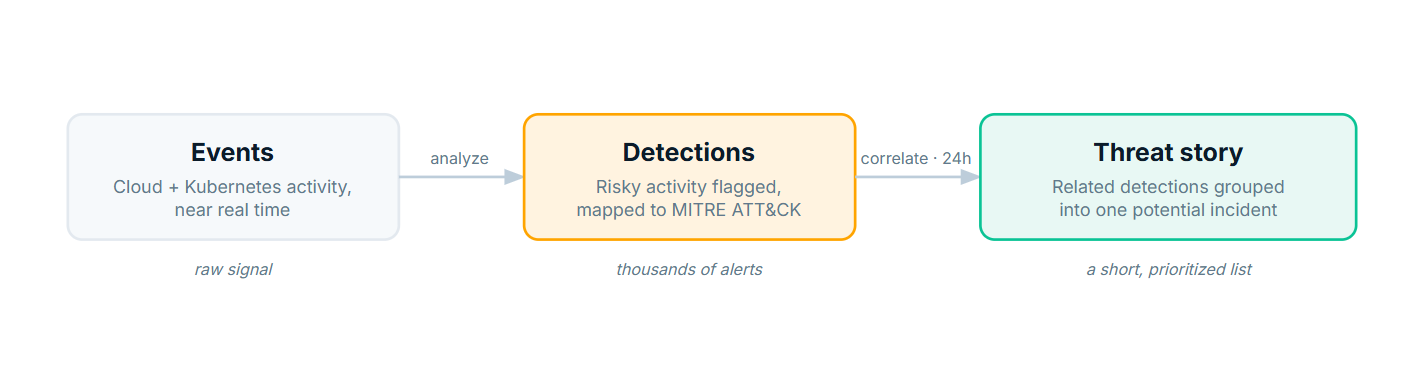
Policy findings tell you where a resource is misconfigured. Threat detection tells you when something is actively happening. Cloud Exposure analyzes your cloud activity in near real time to catch post-breach activity that posture and vulnerability scans miss, across both your cloud accounts and your Kubernetes workloads.
| Method | How It Works |
|---|---|
| Agentless | Collects and analyzes cloud provider logs (AWS, Azure, GCP) through API integrations. Nothing to install. |
| Sensor-based (eBPF) | Installs a lightweight sensor on Kubernetes clusters for runtime visibility into activity that cloud logs cannot see. |
Tenable flags risky activity as detections, each mapped to the MITRE ATT&CK framework for cloud. Detections fall into three families:
| Family | What It Catches |
|---|---|
| Suspicious activity | Events that match known attacker behavior, such as creating an excessive admin role or disabling a logging service. |
| Anomaly detection | Behavior that deviates from an identity's baseline. Tenable profiles every user and service identity from up to 12 months of activity, with a 30-day minimum learning period. |
| Malware execution | A process running a binary whose SHA-256 hash is flagged as known or suspected malware. |
A busy environment can generate thousands of individual detections. A threat story consolidates related detections that share entities within a 24-hour window into a single potential incident, so your team triages a short list of prioritized threats instead of raw alerts. Some threat stories include an AI-generated summary and impact analysis, and you can track each one as Open, In Progress, or Resolved.
From raw activity to a prioritized incident
 Operations
| Path | Description |
|---|---|
| Mobilization | Route findings to responsible team members via Jira, ServiceNow, Slack, or email. Manual or automated via rules. |
| Remediation steps | Each finding describes what to do. Steps appear in the finding view and in any outbound ticket or notification. |
| One-click remediation | The platform applies the fix directly, provided it has the necessary permissions. Covers a range of IAM and configuration findings. |
 Hexa AI
 is an AI-powered assistant built into the console. Ask about your environment in plain language and get answers grounded in your live data, no query syntax, no digging through menus, no pivoting between tools. Hexa AI is read-only: it investigates, correlates, and points you to the right workflow, but never changes your environment or Tenable configuration.
| Capability | Example Query |
|---|---|
| Cloud asset investigation | Show me all S3 buckets that are publicly accessible and unencrypted. |
| Identity & access review | List IAM users with admin privileges who haven't logged in for 90 days. |
| Compliance reporting | Summarize our compliance posture against CIS AWS Foundations. |
| Policy building | Build a policy that detects publicly exposed databases with no encryption. |
| Documentation lookup | How do I onboard a new AWS account? |
| Risk and findings analysis | Which EC2 instances have critical vulnerabilities and are internet-facing? |
 Scopes & Projects
Scope tree vs. projects
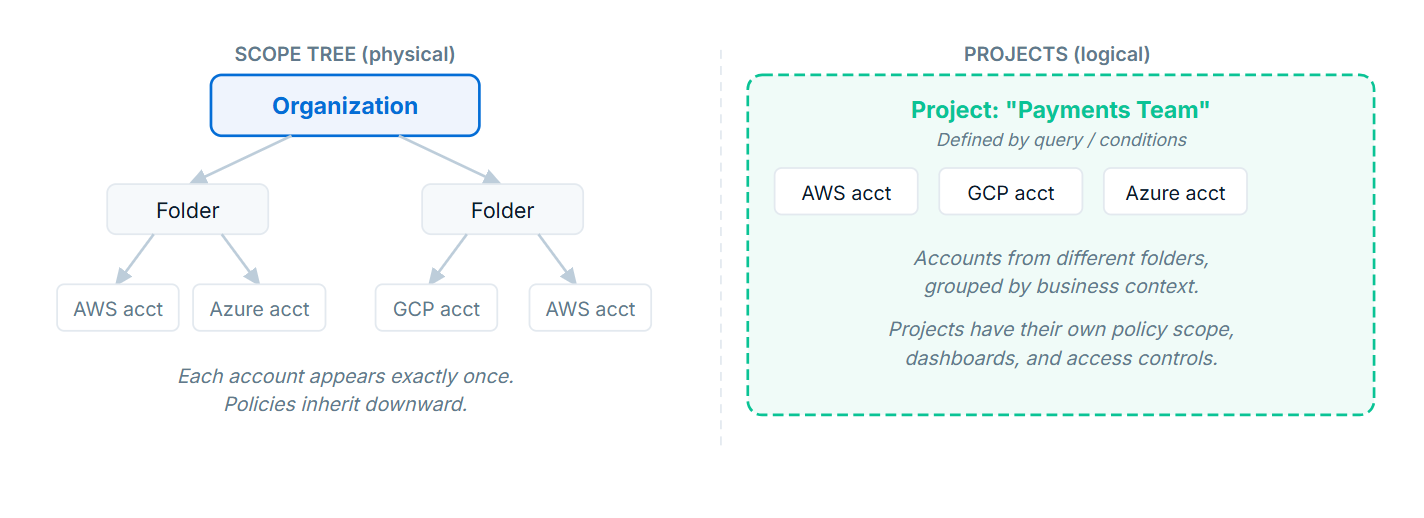
The scope tree mirrors your cloud provider's folder and account structure. Each account appears exactly once. Policies and access rights cascade downward through the tree.
Projects cut across the scope tree. A project is a logical grouping defined by a query or set of conditions. It can include accounts from different folders, different providers, or different organizational units. Projects have their own policy scope, dashboards, and user access controls.
 Decision Tree: Where Do I Go?
I Want to Find and Query Resources
| Task | Where to Go |
|---|---|
| Browse all cloud resources (inventory) | Explore > Inventory |
| Run a custom query (joins, filters, relationships) | Explore > Explorer |
| View IAM identities and permissions | Explore > IAM |
| Ask in plain language (no query syntax) | Hexa AI (top-right icon) |
I Want to Work with Findings and Risks
| Task | Where to Go |
|---|---|
| View and triage cloud misconfigurations | Risks > Cloud Findings |
| View IaC / code repository findings | Risks > IaC Findings |
| View overprivileged identities | Risks > Excessive Permissions |
| View threat detections or anomalies | Risks > Threat Detections |
| Task | Where to Go |
|---|---|
| Enable, disable, or configure built-in policies | Policies > Cloud Policies |
| Create a custom policy (Explorer-based) | Policies > Cloud Policies > Custom |
| Suppress a finding (add exclusion) | Policies > Exclusions |
I Want to Route Findings to My Team
| Task | Where to Go |
|---|---|
| Create a Jira/ServiceNow ticket for a finding | Risks > Cloud Findings > Mobilize |
| Set up automatic ticket creation rules | Operations > Automations |
| Configure integrations (Jira, Slack, ServiceNow) | Settings > Integrations |
I Want to See Overall Risk Posture and Trends
| Task | Where to Go |
|---|---|
| View risk dashboards and widgets | Dashboards |
| Run or schedule a compliance report | Reports > Compliance |
I Want to Configure the Platform
| Task | Where to Go |
|---|---|
| Connect cloud accounts (AWS, Azure, GCP) | Settings > Integrations |
| Create or manage projects | Settings > Organization > Projects |
| Manage user access and roles | Settings > Access Management |
 Concept Map: Entity Relationships
This map ties together every term on this page. Read it top to bottom: it starts with the widest container and ends with what you act on.
Cloud Exposure entity relationship map
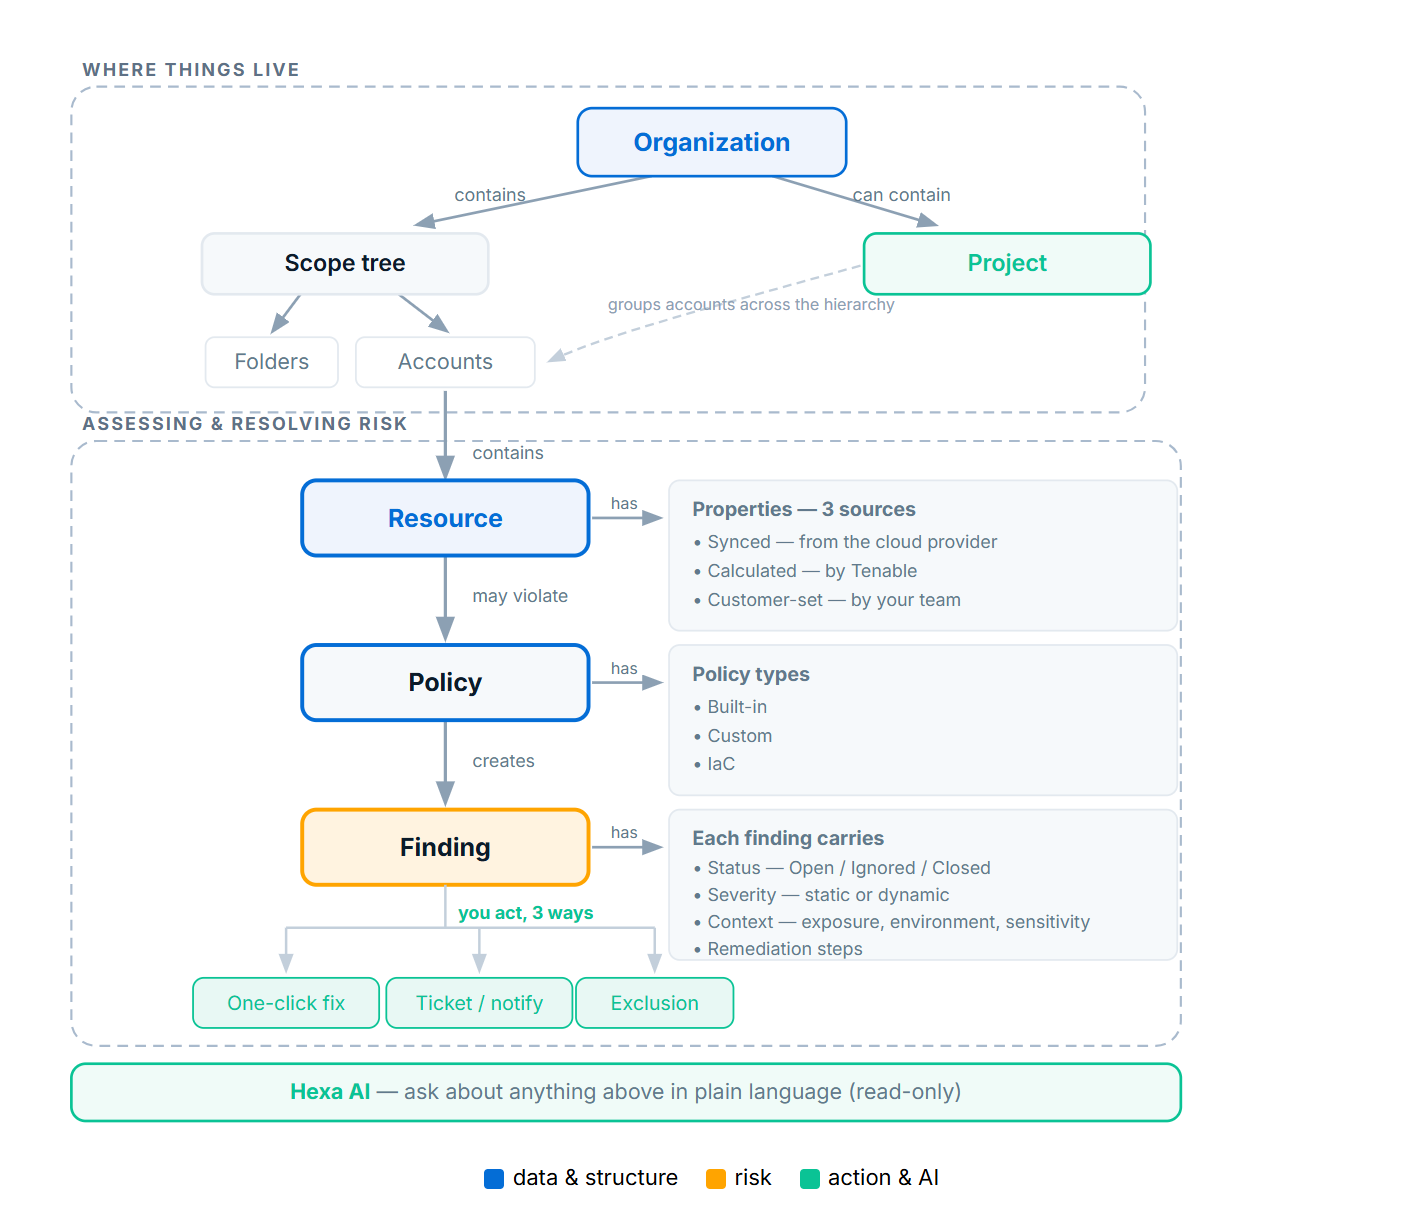
Everything lives under your Organization, the top of Cloud Exposure.
The scope tree mirrors your actual cloud environment. Its folders and accounts match the structure in your cloud provider, and each account appears exactly once. Policies and access rights cascade down the tree.
A project is a virtual grouping that sits alongside the scope tree. It pulls together accounts from anywhere in the hierarchy, across folders and providers, to represent something your business cares about, such as a production environment or one team's footprint. A project has its own policies, dashboards, and access controls.
Each account contains resources: the VMs, buckets, roles, and other cloud assets the platform tracks. Every resource carries properties from three sources, synced from the cloud provider, calculated by Cloud Exposure, and set by your team.
A resource may violate a policy. Each violation creates a finding that carries its status, severity, context, and remediation steps. From a finding you can act: apply a fix, open a ticket, or add an exclusion.
Hexa AI reads across all of this in plain language, and never changes anything.
 Cloud Exposure & Tenable One
Cloud Exposure integrates with Tenable One, Tenable's exposure management platform. When connected, your cloud data flows into three Tenable One features.
| Feature | What It Adds |
|---|---|
| Lumin Exposure View | Business-aligned cyber exposure score for cloud assets. Track overall cloud risk as a contribution to your organization's total exposure score, broken down by asset type, cloud provider, or tag. |
| Tenable Inventory | Combines Cloud Exposure cloud data with context from other Tenable products. Each asset shows related attack paths, exposure scores, criticality ratings, and cross-product relationships in a single view. |
| Attack Path Analysis | Maps the routes an attacker could take to reach critical assets. Pairs your cloud data with the MITRE ATT&CK framework to surface highest-risk paths and choke points where a single fix disrupts multiple attack chains. |
Required License: Tenable One integration requires a separate Tenable One license.
What to do next:
Now that you know how the pieces fit together, dig into the concepts in more depth. See Overview.