How Tenable Lumin Can Help
Tenable Lumin summarizes key assessment maturity metrics to help improve assessment capabilities and security responsiveness. Tenable Lumin provides detailed analysis into asset scan distribution, frequency, and vulnerability age to strengthen program effectiveness and focus on process maturity. Interactive widgets allow analysts to drill into assessment maturity data to investigate the security posture of underlying assets. Tenable Lumin measures remediation responsiveness, remediation coverage, and provides the proper context for an organization’s process risk mitigation efforts.
The metrics provided by Remediation Maturity scores allow organizations to pinpoint the specific strengths and weaknesses of their remediation efforts. They can use this information to better understand their processes and modify them accordingly - either by changing those processes and/or making further investments.
Remediation maturity metrics include:
-
Remediation Maturity Grade (A-F) for Org and Business Contexts
-
Remediation Maturity Trending (Organizations vs Industry vs Population)
-
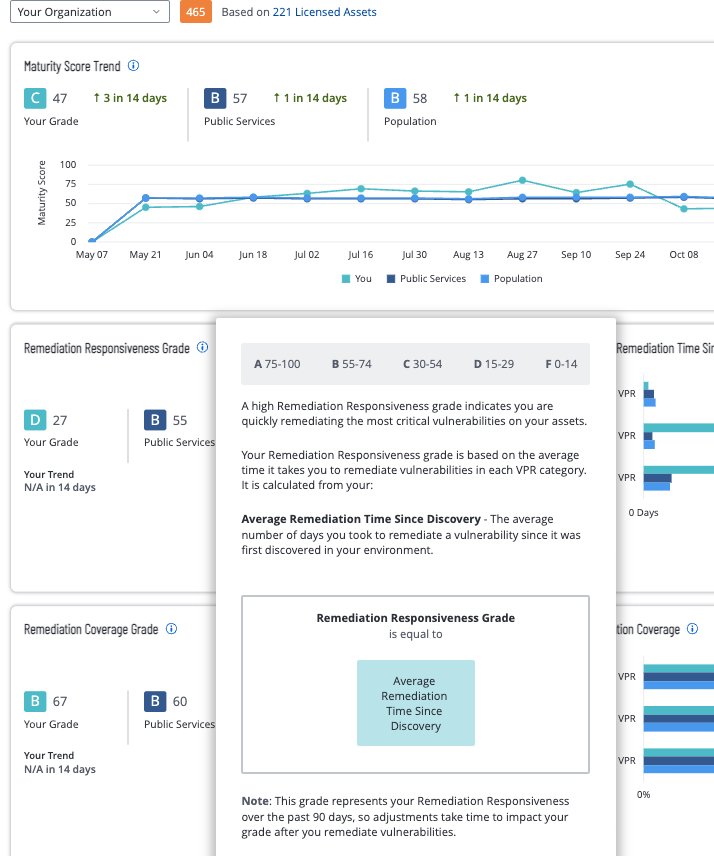
Remediation Responsiveness Grade → Remediation Time Since -- Recovery and Remediation Time Since Vulnerability Publication
Tenable Lumin provides security teams with a list of the top recommended actions that reduce the most cyber exposure, to translate business decisions on risk appetite to technical guidance for teams to action. For additional information, teams can drill down into specific vulnerabilities or assets for business and risk context to enable more effective remediation.
Use the Tenable Lumin dashboard to understand your CES and access details pages.
-
(1) Cyber Exposure Score widget — How does your overall risk compare to other Tenable customers in your Salesforce industry and the larger population?
-
(2) Cyber Exposure Distribution Trend widget — How has the overall risk for your entire organization changed over time?
-
(3) Assessment Maturity widget — How frequently and thoroughly are you scanning your assets?
-
(4) Remediation Maturity widget — How quickly and thoroughly are you remediating vulnerabilities on your assets?
-
(5) Cyber Exposure Alerts widget — What important cyber security alerts you should be aware of?
-
(6) Actions to Reduce CES widget — What would the impact be if you addressed these recommended actions?
-
(7) Mitigations widget — What endpoint protection agents are running on your assets?
-
(8) Cyber Exposure Score by Business Context/Tag widget — How do assets with different tags (unique business context) compare?

By drilling down into these widgets, organizations can get a detailed picture of their remediation progress and standing. For example, by drilling down into the (4) Remediation Maturity widget presents a wealth of remediation information, from a grade standing on remediation progress against other peer organizations, to recommended actions and remediation time frames.
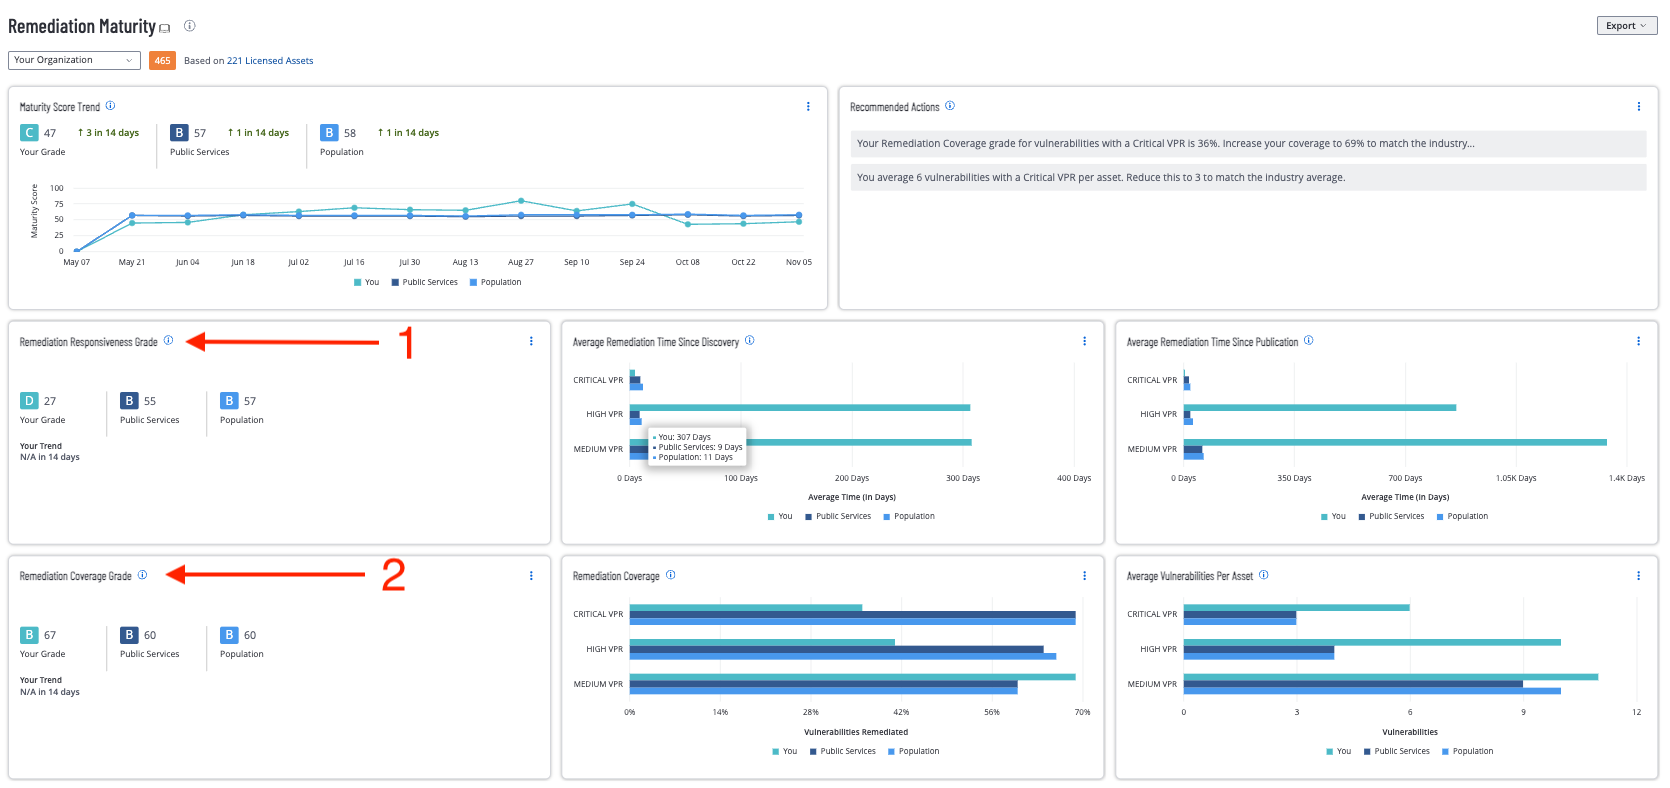
Drilling deeper into grade standings displayed is the (1) Remediation Responsiveness Grade, which is based on the average time taken to remediate vulnerabilities in each VPR category...
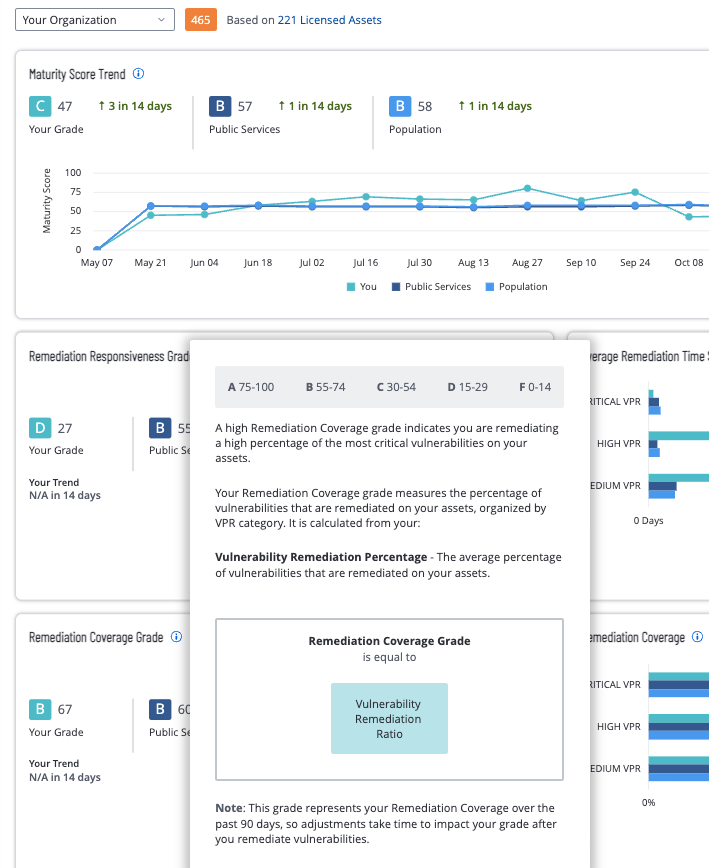
...and the (2) Remediation Coverage Grade, which measures the percentage of vulnerabilities remediated on your assets, organized by VPR category.
More information on getting started with Tenable Lumin can be found here.