Exposure View
The Exposure View page in Tenable Exposure Management allows you to quickly view your global CES, see its changes and trends over time, view important benchmark comparisons, and assess your overall risk. The Exposure View page includes several tools that help you understand:
-
Your overall security posture as it relates your business context
-
The criticality of your assets
-
The effectiveness of your efforts to remediate vulnerabilities across your workspace
An exposure card represents the incoming data from your configured tags and data sources. It aggregates and normalizes the data to provide a visualization of your Cyber Exposure Score (CES) and other metrics. Users can create custom cards, or use Tenable-provided cards to gain insight and guidance on what areas need their attention most.

To access the Exposure View page:
Required User Role: Basic User, Scan Operator, Standard User, Scan Manager, Administrator, or Custom Role
-
In the left navigation menu, click Exposure View.
A menu appears.
-
Click Dashboards.
The Exposure View page appears.
The Exposure View page includes the following sections:
Exposure Card Library
An exposure card represents the incoming data from your configured tags and data sources. It aggregates and normalizes the data to provide a visualization of your Cyber Exposure Score (CES) and other metrics. Users can create custom cards, or use Tenable-provided cards to gain insight and guidance on what areas need their attention most.
The exposure card library on the left side of the Exposure View page allows you to interact with the following types of exposure cards:
| Card type | UI Image |
|---|---|
| Built-in Tab | |
|
A Tenable-provided Global Exposure Card that shows your Overall Score based on all internal and external data within Tenable Exposure Management. |

|
|
Tenable-provided Exposure Category cards based on data from the following categories:
Note: The widgets and data on each card are determined by the type of data within each category.
|

|
| Custom Tab | |
|
Data from user-created custom exposure cards. For more information, see Manage Exposure Cards. |
|

General Exposure Card Data
At the top of the Exposure View, you can view and manage the card data that appears within the Exposure View.
Here, you can:
-
In the upper-left corner of the page, view the time at which Tenable Exposure Management last updated the CES.
-
In the upper-left corner of the page, view the sources whose data is calculated as part of the exposure card.
-
In the upper-left corner of the page, click Show Details to view the following exposure card information:
-
Card Info, such as the user that created the exposure card, and the date and time at which the exposure card was created.
-
A full list of the data Tenable Data Sources whose data is calculated as part of the exposure card.
-
CES
Required User Role: Basic User, Scan Operator, Standard User, Scan Manager, Administrator, or Custom Role
By default, the Exposure View page displays your Global Cyber Exposure Score. You can select a specific card via the exposure card library to view your Cyber Exposure Score for that card. CES data is available for the following categories:
-
Tenable-provided exposure cards.
-
Data from user-created custom exposure cards.
Note:Tenable Exposure Management does not include assets older than 90 days in your CES.
To view your CES for an exposure card:
-
In the exposure card library, select the exposure card for which you want to view your CES.
The Exposure View page displays CES details for the selected card.
While viewing the CES details for a card, you can:
-
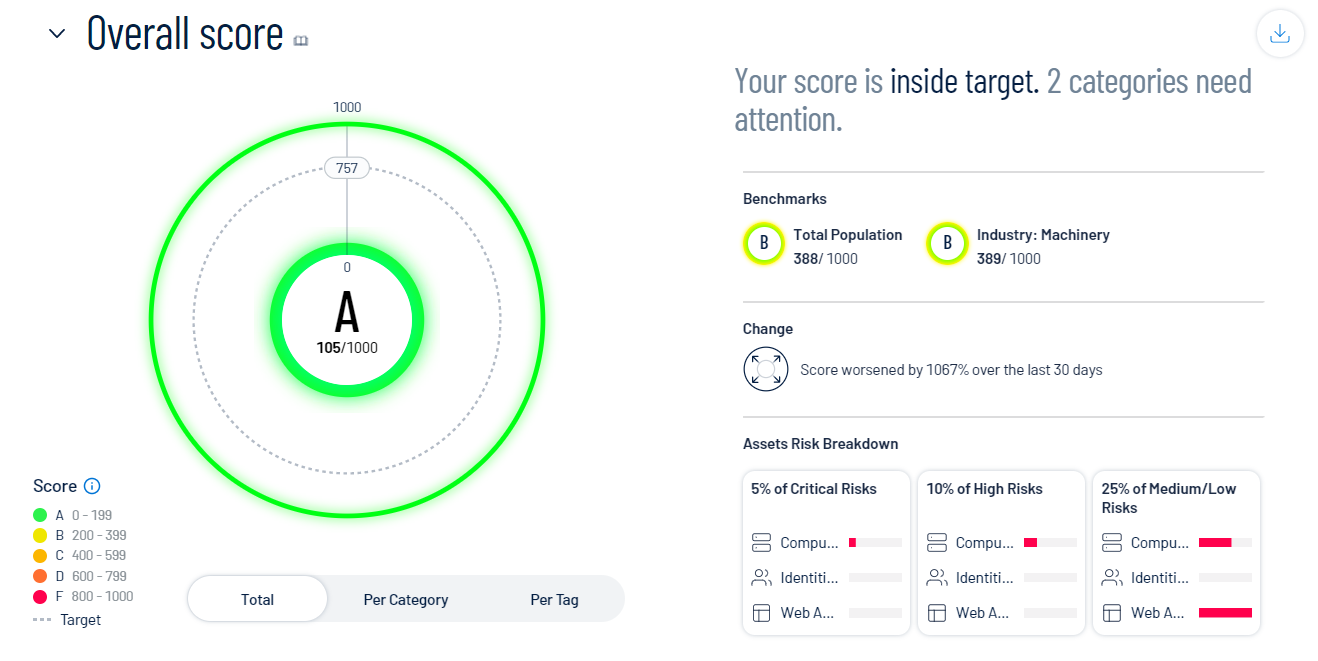
View a graphical representation of your CES grade as it compares to your industry and the total population:
-
To view your total CES regardless of the data source, below the circle graph, click Total.
-
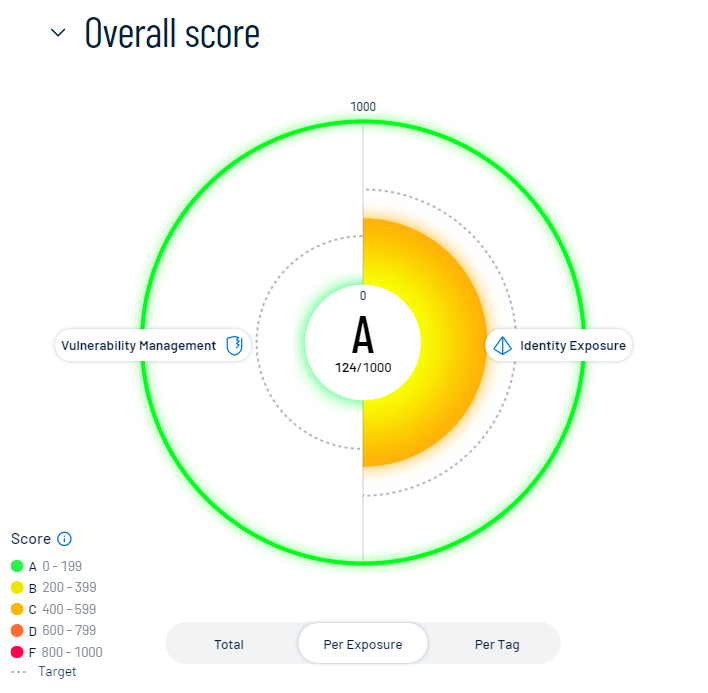
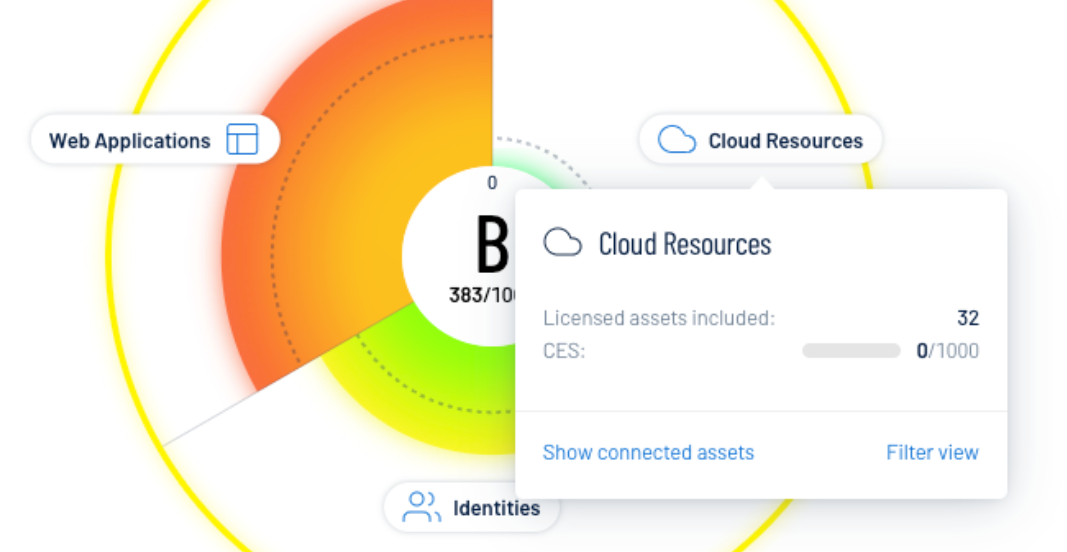
To view your CES separated based on the source of the exposure, below the circle graph, click Per Exposure.
The CES graph splits into sections that represent each exposure source, for example, Identity Exposure. For more information, see Tenable Exposure Management Metrics.
-
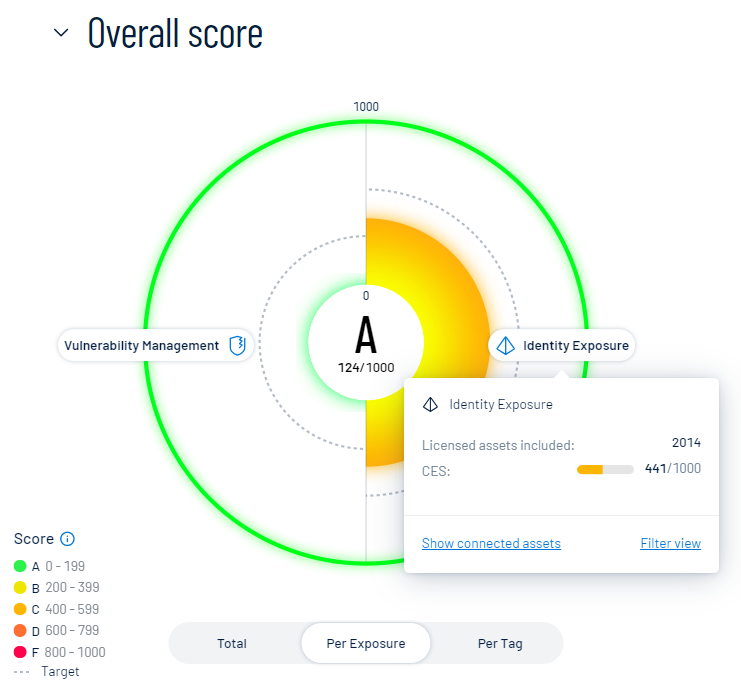
Within the CES graph, click an individual category name to view additional category information, connected assets, and to filter the Exposure View page by the selected category.
-
-
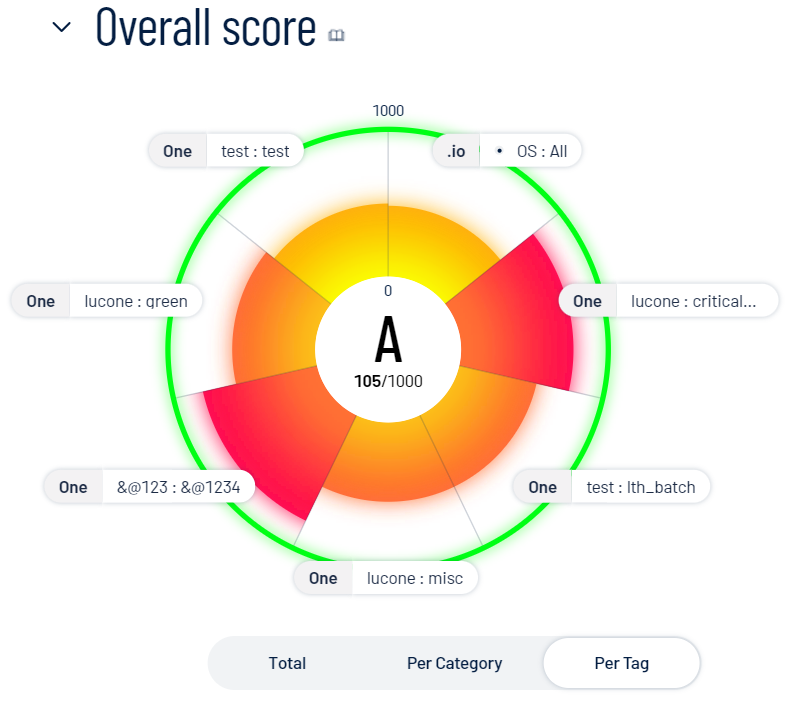
To view the top tags driving your score, below the circle graph, click Per Tag.
Note: The Exposure View page displays a maximum of 10 tags within the graph.
The CES graph splits into sections that represent the top 10 tags affecting your Cyber Exposure Score. For more information, see Tags.
-
Within the CES graph, click an individual tag name to view additional tag information, connected assets, and tag details.
-
-
-
To the right of the CES graph, view a small blurb that:
-
Indicates how your score compares to the baseline target.
-
Identifies the performance of your categories. For example, this blurb may explain that you have two critical categories.
-
-
On the right side of the page, in the Benchmarks section, view how your CES compares to others is your industry and in the total population.
-
In the Change section, view how your CES has changed within the last 30 days.
-
In the Asset Risk Breakdown section, view tiles that indicate your asset risk:
-
The Critical Risks tile shows the percentage of your assets with associated vulnerabilities of critical severity, as well as the data source(s) of those assets.
-
The High Risks tile shows the percentage of your assets with associated vulnerabilities of high severity, as well as the data source(s) of those assets.
-
The Medium/Low Risks tile shows the percentage of your assets with associated vulnerabilities of medium or low severity, as well as the data source(s) of those assets.
Click any tile to navigate to the Assets page filtered by the asset severity type you selected.
Caution: Data in the Asset Risk Breakdown section is based on your Vulnerability Priority Rating (VPR). As a result, if you configure your Tenable One Vulnerability Management vulnerability severity setting to use CVSS, data in this section may be inconsistent.Note: Since an asset can have multiple risks across all severities, the sum of the percentages in the Asset Risk Breakdown section may exceed 100%.
-
CES Trend
Required User Role: Basic User, Scan Operator, Standard User, Scan Manager, Administrator, or Custom Role
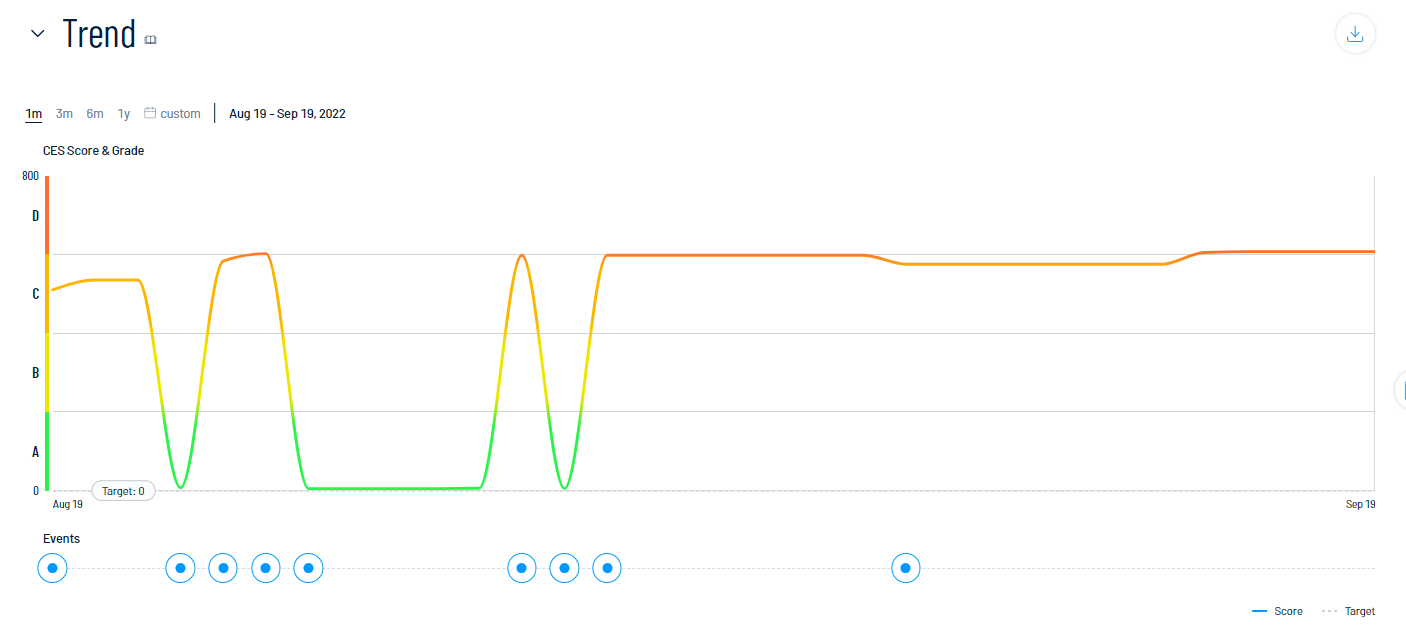
The Trend section of the Exposure View page shows how your CES has trended over time. You can also view information about specific events that have contributed to your CES.
To view your CES trend for an exposure card:
-
In the exposure card library, select the exposure card for which you want to view your CES trend.
The Exposure View page displays CES details for the selected card.
-
Scroll down to the Trend section.

In the Trend section, you can:
-
View a graphical representation of your CES trend over time.
-
At the top of the trend graph, select a timeframe for which you want to view your CES trend:
-
1m — View your CES trend over the previous month.
-
3m — View your CES trend over the previous 3 months.
-
6m — View your CES trend over the previous 6 months.
-
1y — View your CES trend over the previous year.
-
Custom date range — Use the calendar tool to select a specific date range over which to view your CES trend.
-
-
At the bottom of the trend graph, click an
 event marker. In the Events section, Tenable Exposure Management displays specific information about that event and how it affects your CES.
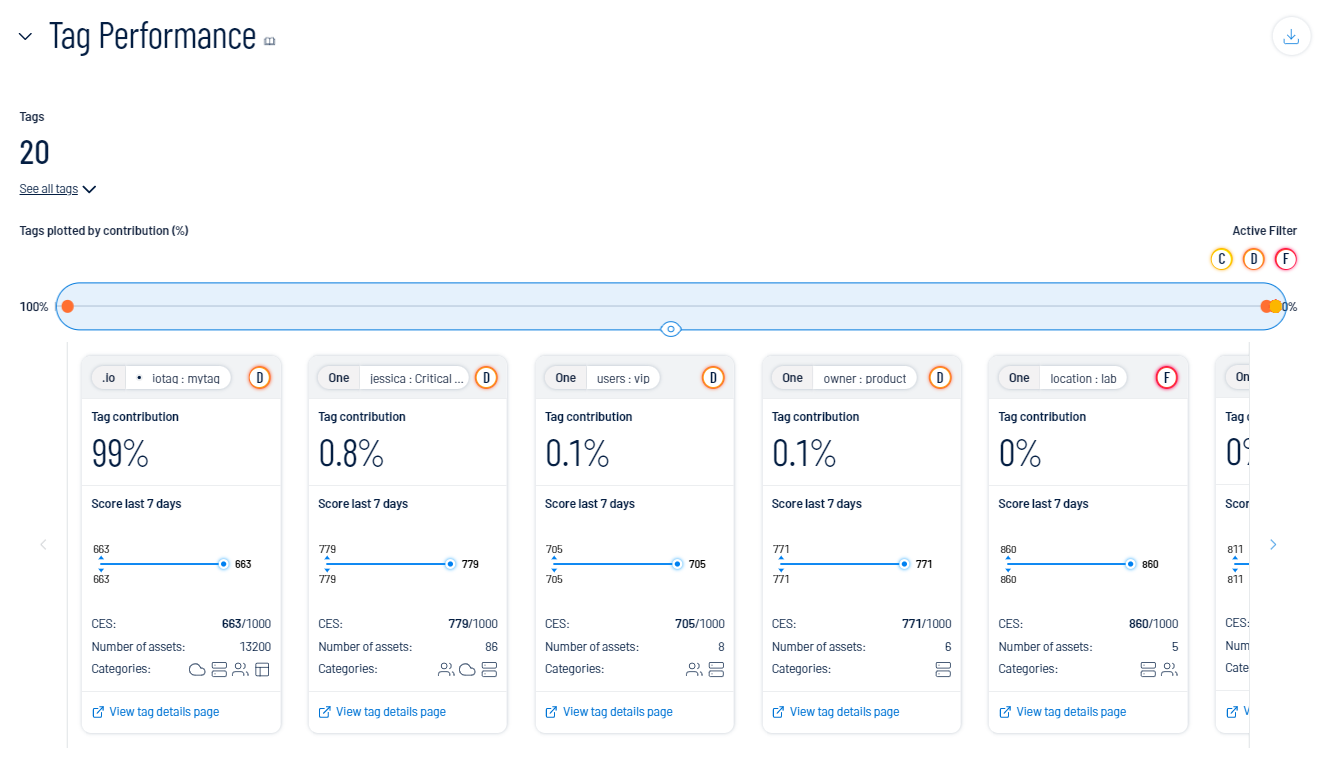
Tag Performance
Required User Role: Basic User, Scan Operator, Standard User, Scan Manager, Administrator, or Custom Role
The Tag Performance section of the Exposure View page shows how the tags applied to your assets affect your CES. You can use this information to answer the following questions:
-
What tags are part of my current exposure view?
-
Which tags drive my CES?
-
Which tags should I focus on to improve my scores?
To view your tag performance:
-
In the exposure card library, select the exposure card for which you want to view your tag performance.
The Exposure View page displays CES details for the selected card.
-
Scroll down to the Tag Performance section.
In the Tag Performance section, you can do the following:
-
View the number of tags within your Tenable Exposure Management instance.
-
To see a list of all tags, click See all tags.
A list of your tags appears in Category:Value pair format.
-
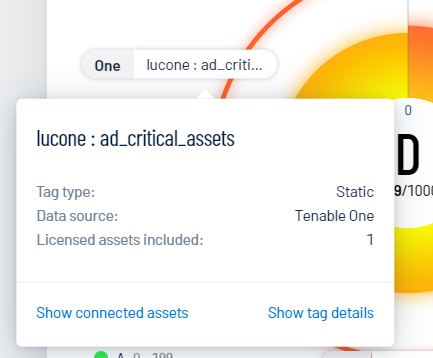
Click on a tag Category:Value pair to view additional details:
-
Tag Type — The tag type (e.g., static).
-
Data Source — The application in which the tag was created. For more information, see Data Sources.
-
Show connected assets — Click to view a list of assets to which the tag is applied. Tenable Exposure Management redirects you to the Assets page filtered by the selected tag.
-
Show tag details — Click to view all details for the tag. Tenable Exposure Management redirects you to the Tag Details page.
-
-
-
View a plot point graph of your tags based on the percentage of their contribution.
Tip: Click on a plot point to highlight the corresponding tile below.
Note: Because an asset can be tagged with more than one tag, tags can overlap, causing your total percentage to exceed 100%.
-
In the Active Filter section, click on a letter grade score to filter all data in the Tag Performance section by tags that fall under the selected score.
-
View tiles that highlight the performance of each tag. On any tile, you can:
-
View the name of the Category:Value pair.
-
View a letter grade representation of your CES grade as it compares to your industry and the total population.
-
View the Tag contribution percentage (i.e., the percentage of your CES score that comes from assets to which this tag is applied).
-
View a graphical representation of the CES trend over the last 7 days.
-
View the tag CES.
-
View the Number of assets to which the tag is applied.
-
View the Categories to which the tag belongs. For more information, see Tenable Exposure Management Metrics.
-
Click View tag details page to navigate directly to the Tag Details page.
-
To the right of the tiles, click the
 button to scroll through available tiles.
-
Remediation SLA
Required User Role: Basic User, Scan Operator, Standard User, Scan Manager, Administrator, or Custom Role
The Remediation SLA section of the Exposure View page shows Remediation Service Level Agreement (SLA) data for Tenable Exposure Management. SLA represents the acceptable time frame between when a finding is discovered and when it fixed or remediated. Here, you can visualize risks by severity and by compliance with your SLAs to determine how well you are aligning to your organization's policy.
How is my SLA calculated?
Tenable Exposure Management calculates your SLA efficiency by comparing the number of active findings inside your SLA versus the number of active findings that are inside AND outside your SLA:
Findings inside / Findings (Inside + Outside)
Tenable Exposure Management includes all active findings in SLA calculations, but only includes remediated findings if they were fixed during the remediation timeframe. To determine if a finding is inside or outside of your SLA, compare the following finding properties:
-
All active findings: current-date / first-observed-at
-
Remediated findings: last-fixed-at / first-observed-at
The data in the Remediation SLA section applies to all exposure cards within the Exposure View page and are only based on vulnerability findings. Findings without a Vulnerability Priority Rating (VPR) do not count towards SLA calculations.
To view remediation SLA data:
-
In the exposure card library, select the exposure card for which you want to view your tag performance.
The Exposure View page displays CES details for the selected card.
-
Scroll down to the Remediation SLA section.
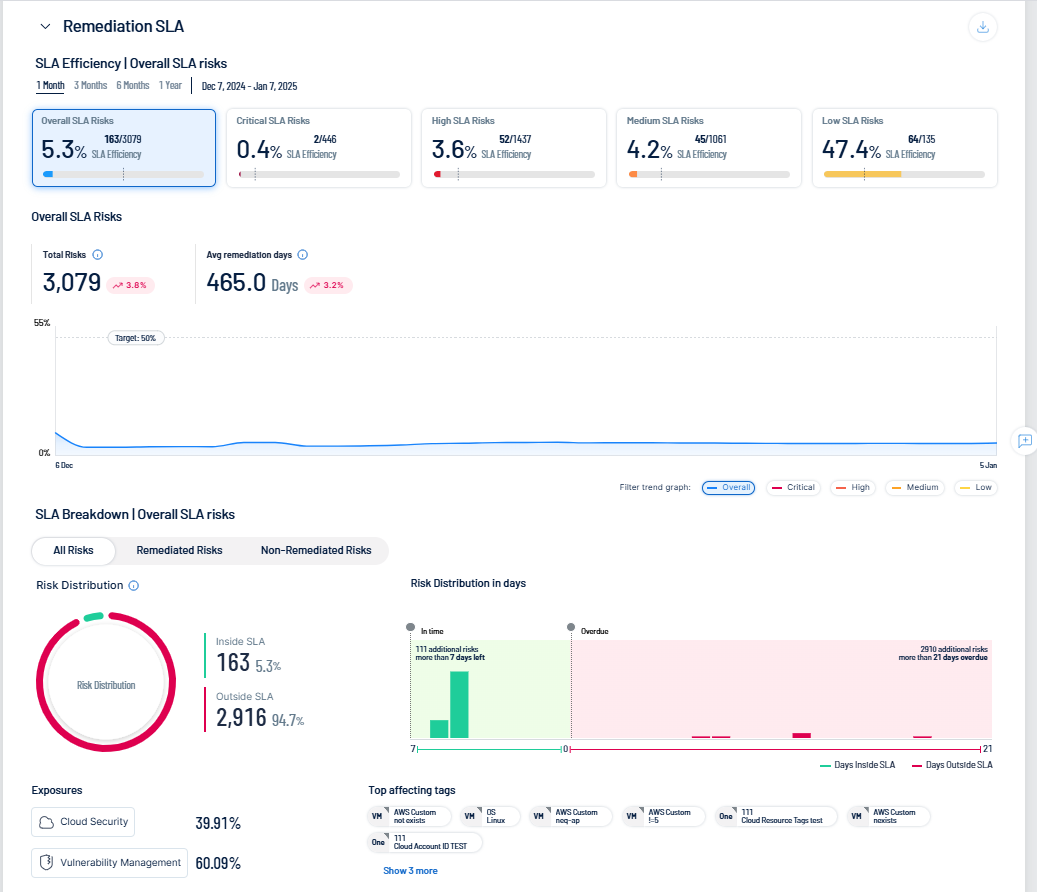
In the Remediation SLA section, you can:
-
Select a timeframe for which you want to view the Remediation SLA data:
-
1 Month —View Remediation SLA data for the previous month.
-
3 Months —View Remediation SLA data for the previous 3 months.
-
6 Months —View Remediation SLA data for the previous 6 months.
-
1 Year —View Remediation SLA data for the previous year.
All data within the Remediation SLA section updates accordingly, including the SLA Efficiency and SLA Breakdown subsections.
-
-
Select a severity level by which you want to filter Remediation SLA data:
-
Overall SLA Risks — View risks for your overall SLA.
-
Critical SLA Risks — View only risks that have a critical severity.
-
High SLA Risks — View only risks that have a high severity.
-
Medium SLA Risks — View only risks that have a medium severity.
-
Low SLA Risks — View only risks that have a low severity.
All data within the Remediation SLA section updates accordingly, including the SLA Efficiency and SLA Breakdown subsections.
-
-
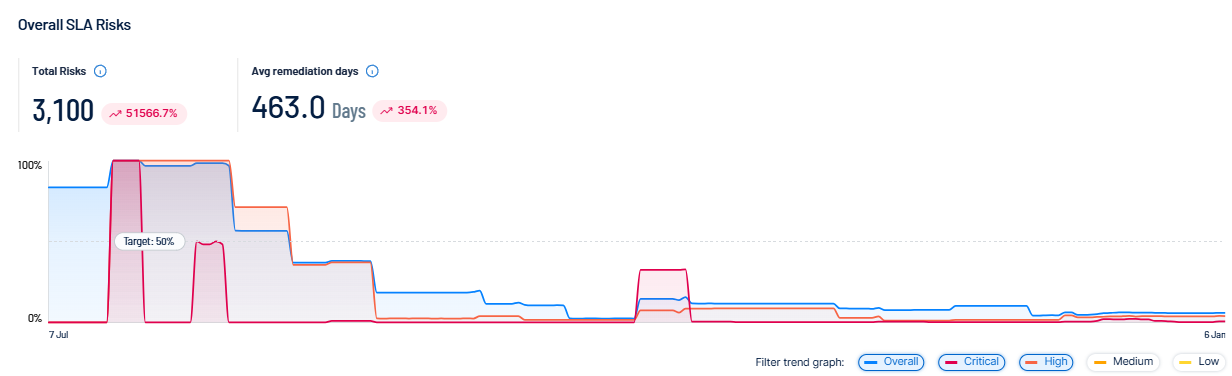
In the trend graph, view SLA trend metrics for the selected range of dates.
-
At the bottom of the trend graph, click one or more severity filters to view on the graph. Multiple severities overlap on the graph to show a holistic view of your SLA risk over time.
-
-
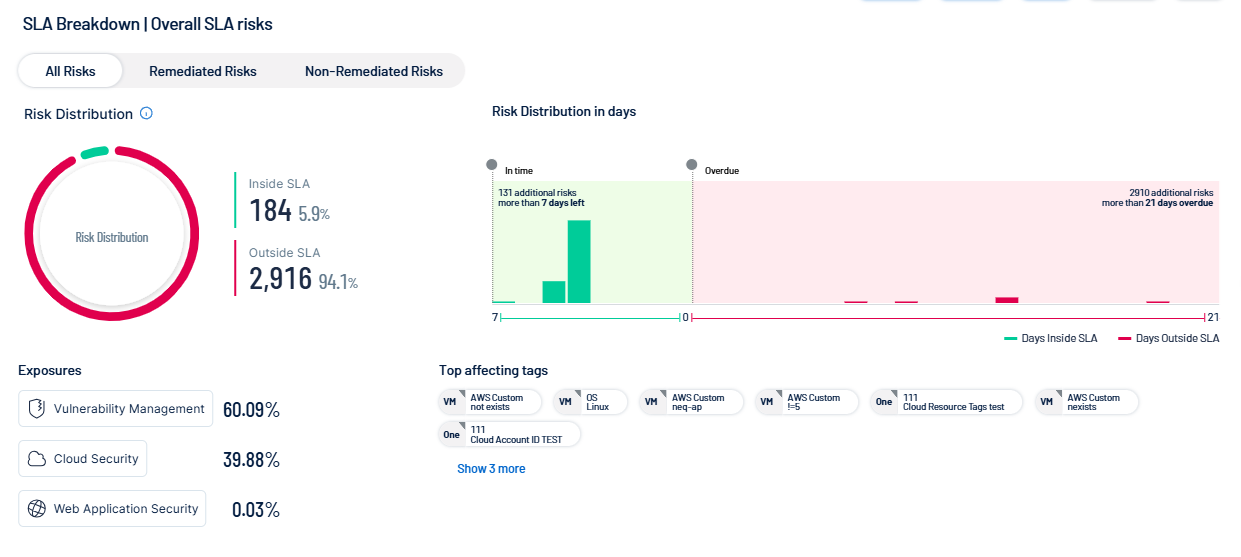
View your SLA Breakdown:
-
Click a risk group type to filter the SLA Breakdown data:
-
All Risks — All risks regardless of remediation status.
-
Remediated Risks — Only remediated risks.
-
Non-remediated Risks — Only non-remediated risks.
-
-
View a graphical representation of your Risk distribution, which shows the number and percentage of risks that fall Inside SLA and Outside SLA.
-
View a graphical representation of your Risk distribution in days, which shows your risk distribution based on the number of days your risks are inside or outside the SLA.
-
View the percentage of Exposures that come from specific exposure categories, for example, Cloud Security. For more information, see Exposure Categories.
-
In the Top Affecting Tags section, view the top tags outside of your SLA, listed in descending order. Click on a tag to view additional details.
-
What to Do Next
Additionally, you can manage the Exposure View page in the following ways: