Tenable Lumin Dashboard Widgets
The following is not supported in Tenable FedRAMP Moderate environments. For more information, see the Tenable FedRAMP Product Offering.
The Tenable Lumin dashboard consists of the following widgets:
- Cyber Exposure Score
- Cyber Exposure Score Trend
- Actions to Reduce CES
- Assessment Maturity
- Remediation Maturity
- Cyber Exposure Alerts
- Mitigations
- Cyber Exposure Score by Business Context/Tag
Note: All Tenable Lumin data reflects all assets within the organization's Tenable Vulnerability Management instance.
How does your overall risk compare to other Tenable customers in your Salesforce industry and the larger population?
| Time Frame | Assets |
|---|---|
| Past 90 days | Licensed assets for your entire organization |
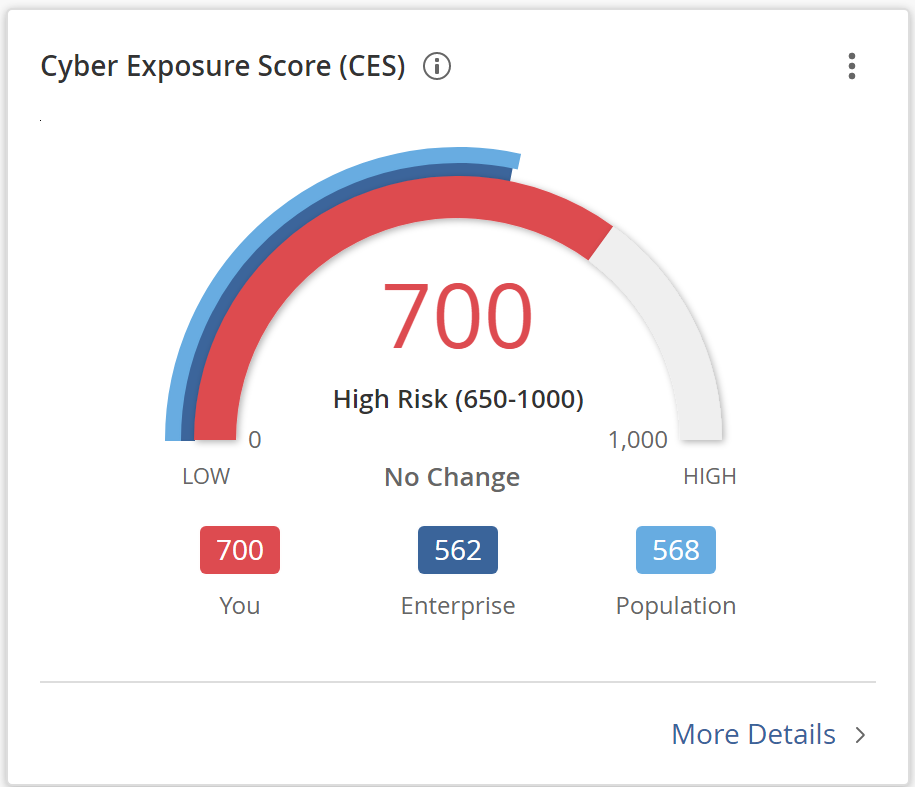
This widget summarizes the CES for your entire organization compared to Tenable customers in your Salesforce industry and the larger population.
In this widget, you can perform the following actions:
-
View a visual representation of your CES compared to the average CES for Tenable customers in your Salesforce industry and the larger population.
- View a summary statement about whether your CES recently increased or decreased.
-
To view details about your CES, click your CES value.
The Tenable Lumin Cyber Exposure Score details panel appears. For more information, see CES Details.
-
Export the dashboard widget.
How has the overall risk for your entire organization changed over time?
| Time Frame | Assets |
|---|---|
| Past 90 days at each point on the graph, recalculated daily | Licensed assets for your entire organization |
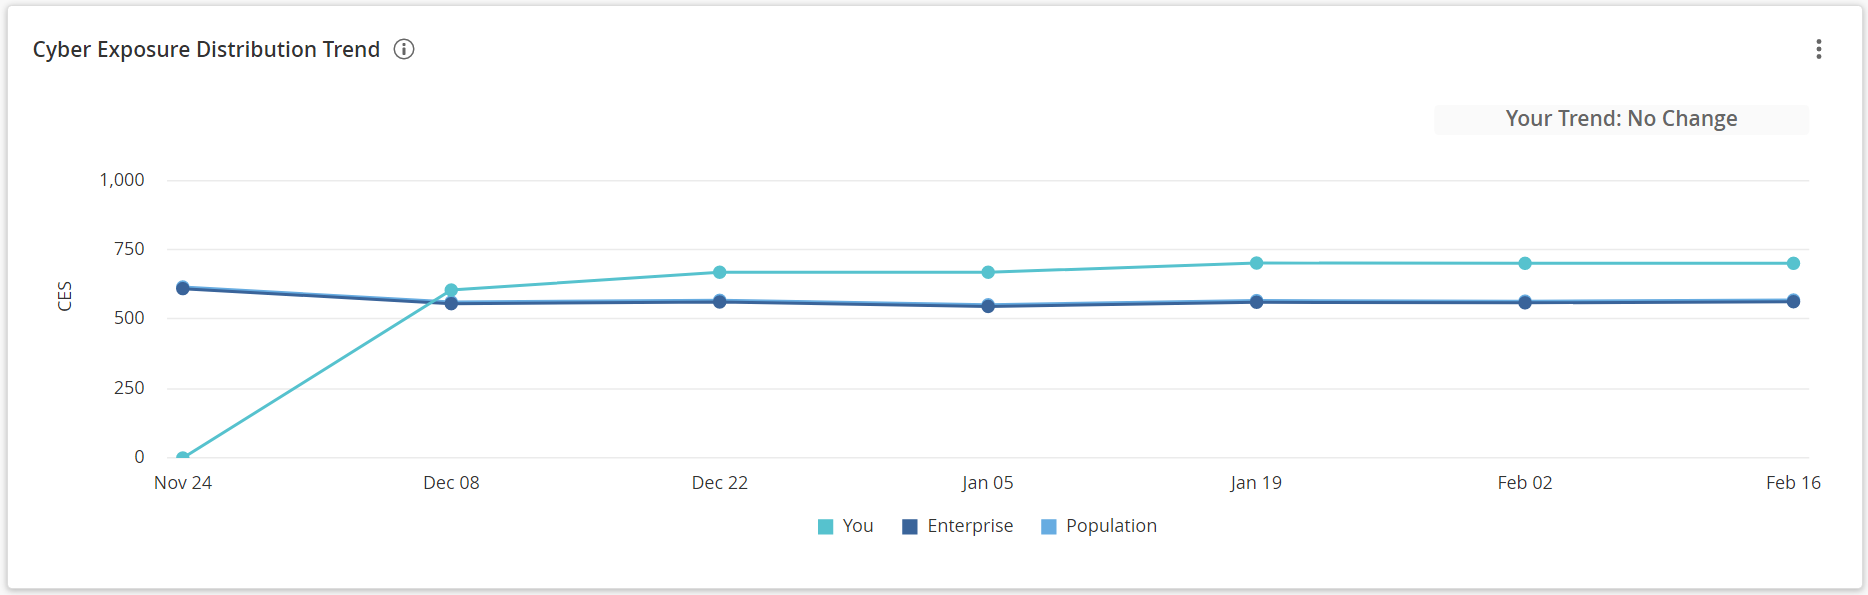
This widget graphs the increases and decreases to your CES and to the average CES for Tenable customers in your Salesforce industry and the larger population.
In this widget, you can perform the following actions:
-
To view details about an industry or population CES value on a specific date, hover over a point on the graph.
The hover text provides historical data about the CES.
-
To view details about your CES value on a specific date, click a point on the You line.
The Tenable Lumin Cyber Exposure Score details plane appears. For more information, see CES Details.
-
To show or hide data for your organization, the industry, or the population, click the boxes in the graph legend.
The system updates the widget to show or hide the data you selected.
-
Export the dashboard widget.
What would the impact be if you addressed all of your top 20 recommended actions?
| Time Frame | Assets |
|---|---|
| Past 90 days | Licensed assets for your entire organization |
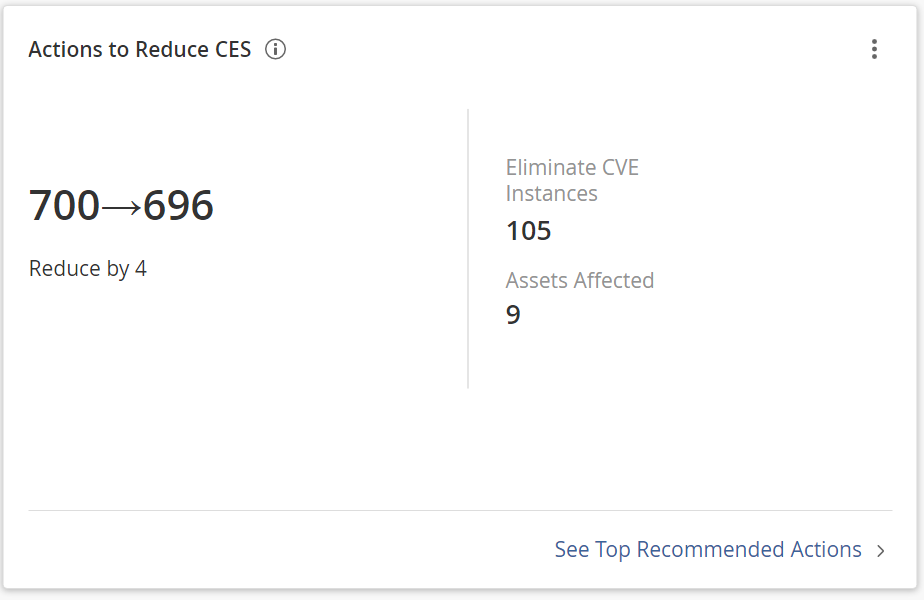
This widget summarizes the impact of your top 20 recommended actions.
In this widget, you can perform the following actions:
- View the expected CES reduction if you address all top 20 recommended actions.
-
View the number of vulnerability instances you would eliminate if you addressed all top 20 recommended actions.
Tip: A vulnerability instance is a single instance of a vulnerability appearing on an asset, identified uniquely by plugin ID, port, and protocol.
- View the number of assets affected by your top 20 recommended actions.
-
To view details about your top 20 recommended actions, click See Top Recommended Actions.
The Tenable Lumin Recommended Actions page appears. For more information, see View Recommended Actions.
-
Export the dashboard widget.
How frequently and thoroughly are you scanning your assets?
| Time Frame | Assets |
|---|---|
| Past 90 days | Licensed assets for your entire organization |
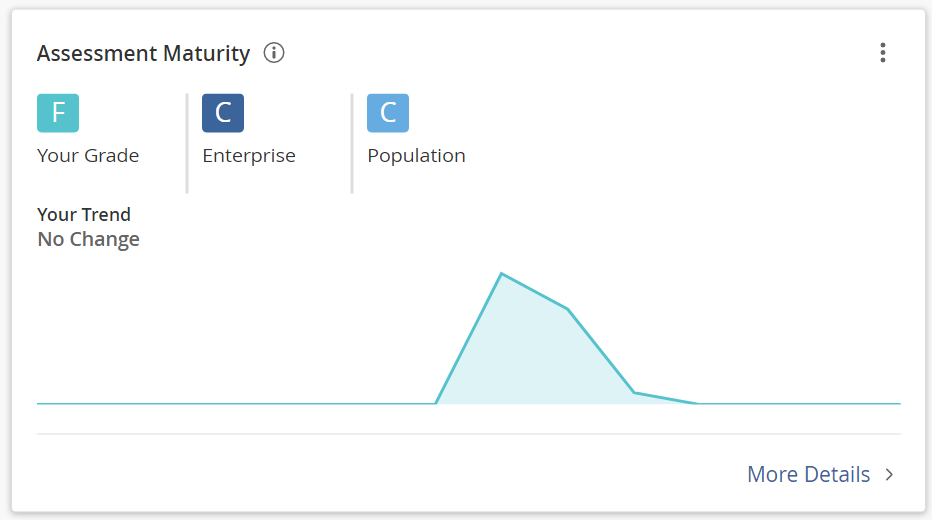
This widget summarizes the Assessment Maturity grade for your entire organization compared to Tenable customers in your Salesforce industry and the larger population.
In this widget, you can perform the following actions:
-
View your Assessment Maturity grade compared to the average Assessment Maturity grade for Tenable customers in your Salesforce industry and the larger population.
- View a summary statement about whether your Assessment Maturity grade recently increased or decreased.
-
To view historical details about your Assessment Maturity grade, hover over a point on the graph.
The hover text provides historical data about the Assessment Maturity grade.
-
To view more details about your Assessment Maturity grade, click More Details.
The Tenable Lumin Assessment Maturity page appears. For more information, see View Assessment Maturity Details.
-
Export the dashboard widget.
How quickly and thoroughly are you remediating vulnerabilities on your assets?
| Time Frame | Assets |
|---|---|
| Past 90 days | Licensed assets for your entire organization |
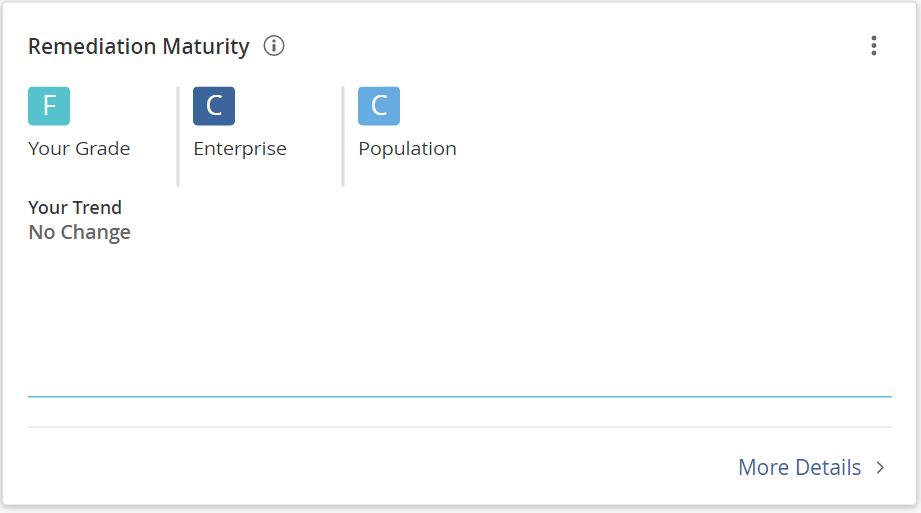
This widget summarizes the Remediation Maturity grade for your entire organization compared to Tenable customers in your Salesforce industry and the larger population.
In this widget, you can perform the following actions:
-
View your Remediation Maturity grade compared to the average Remediation Maturity grade for Tenable customers in your Salesforce industry and the larger population.
- View a summary statement about whether your Remediation Maturity grade recently increased or decreased.
-
To view historical details about your Remediation Maturity grade, hover over a point on the graph.
The hover text provides historical data about the Remediation Maturity grade.
-
To view more details about your Remediation Maturity grade, click More Details.
The Tenable Lumin Remediation Maturity page appears. For more information, see View Remediation Maturity Details.
-
Export the dashboard widget.
What Tenable Research cyber security alerts should you be aware of?
| Time Frame | Assets |
|---|---|
| 6 most recent alerts | Licensed assets for your entire organization |
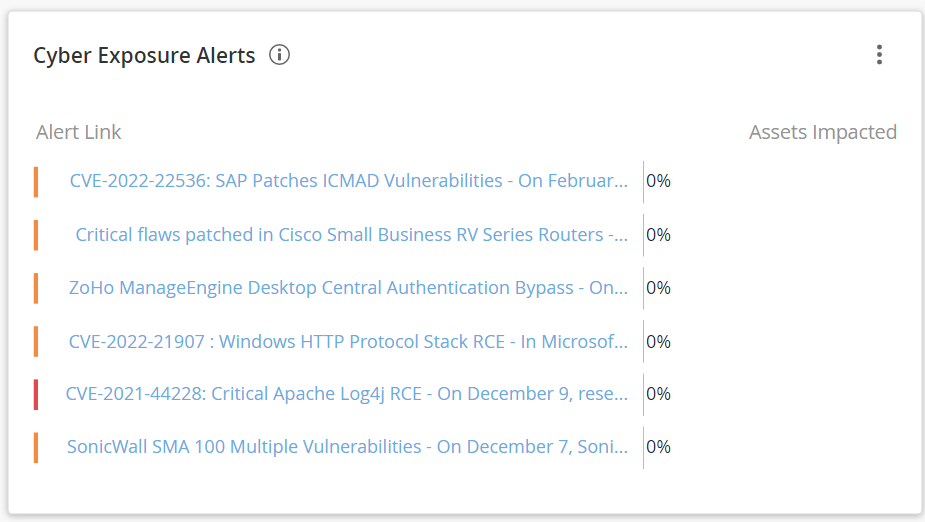
This widget shows the 6 most recent cyber security alerts provided by the Tenable research team. Tenable Lumin provides further details about how many assets are potentially impacted and a link to the Tenable blog post for the alert, where you can view further information and any required responses.
To reduce noise within the Cyber Exposure Alerts widget, Tenable Lumin does not target specific CVEs ( i.e., from Patch Tuesday/Oracle CPU)
In this widget, you can perform the following actions:
-
View cyber exposure alerts with one of the following severities:
-
Information (Low) — The alert contains information that may be of interest, but does not require an immediate response.
-
Advisory (Medium) — The alert contains warning information and may require a response.
-
Response (Critical) — The alert requires an immediate response.
-
-
To view the severity of the alert, a brief description, and the date on which the alert was published, roll over one of the alerts in the widget.
-
To view the percentage of your assets affected by the alert (assets where one of the CVEs associated with the alert is present as a vulnerability on the asset), roll over one of the rows in the Assets Affected column.
If an alert has a CVE but no assets are affected, or you have not yet scanned your assets for the vulnerability, then the Assets Affected column shows a value of 0%. If no CVE is currently assigned to the alert, then the Assets Affected column shows a value of Pending. Once Tenable Vulnerability Management calculates the CVE for the alert, Tenable Lumin updates the column with the appropriate value.
-
To view your vulnerabilities by asset automatically filtered by the CVE associated with the alert, click one of the percentages in the widget.
-
To view the Tenable blog post about the exposure alert, click one of the alerts in the widget.
-
To view the Trending Threats page for an alert, click one of the alerts in the widget.
-
Export the dashboard widget.
How are endpoint protection agents distributed on your assets?
| Time Frame | Assets |
|---|---|
| Past 90 days | Licensed assets for your entire organization |
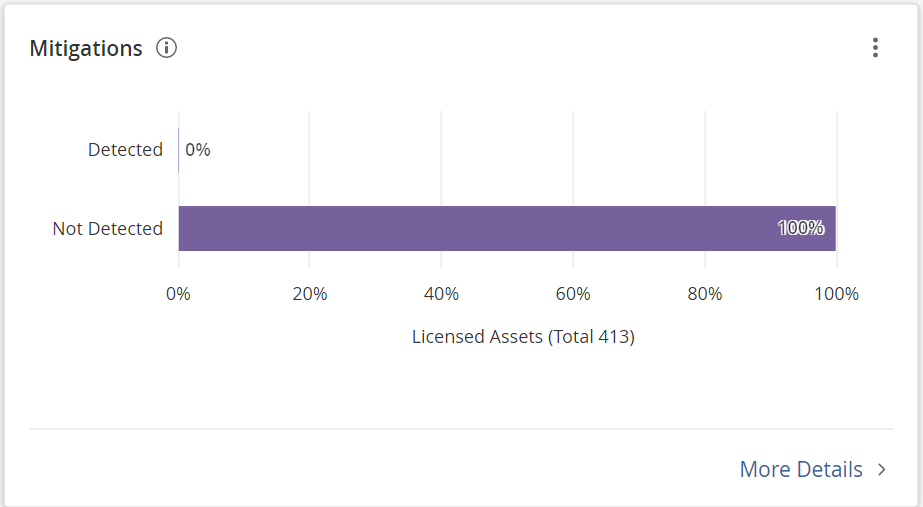
This widget summarizes the distribution of endpoint protection agents on your assets.
If you run an authenticated scan based on the Basic Network Scan template or Advanced Network Scan template or an agent scan based on the Basic Agent Scan or Advanced Agent Scan template, Tenable automatically enables the plugins required to detect mitigations present on your assets. Tenable Lumin defines mitigations as endpoint protection agents, which include antivirus software, Endpoint Protection Platforms (EPPs), or Endpoint Detection and Response (EDR) solutions.
In this widget, you can perform the following actions:
-
To view a list of assets in a Mitigations category, click one of the percentages in the widget.
The Assets page appears, filtered by licensed assets, the mitigations category you selected, and the past 90 days. For more information, see Assets.
Note: When accessing the Assets page from the Mitigations widget, you may see an asset count notification at the top of the page. This notification indicates the number of assets you have permission to view based on the access group to which you belong.
-
To view details about the endpoint protection agents detected on your assets, click More Details.
The Tenable Lumin Mitigations page appears. For more information, see View Mitigations Details in Tenable Lumin.
-
Export the dashboard widget.
Cyber Exposure Score by Business Context/Tag
How do assets with different tags (unique business context) compare?
| Time Frame | Assets |
|---|---|
| Past 90 days |
All licensed assets to which the selected tags apply |
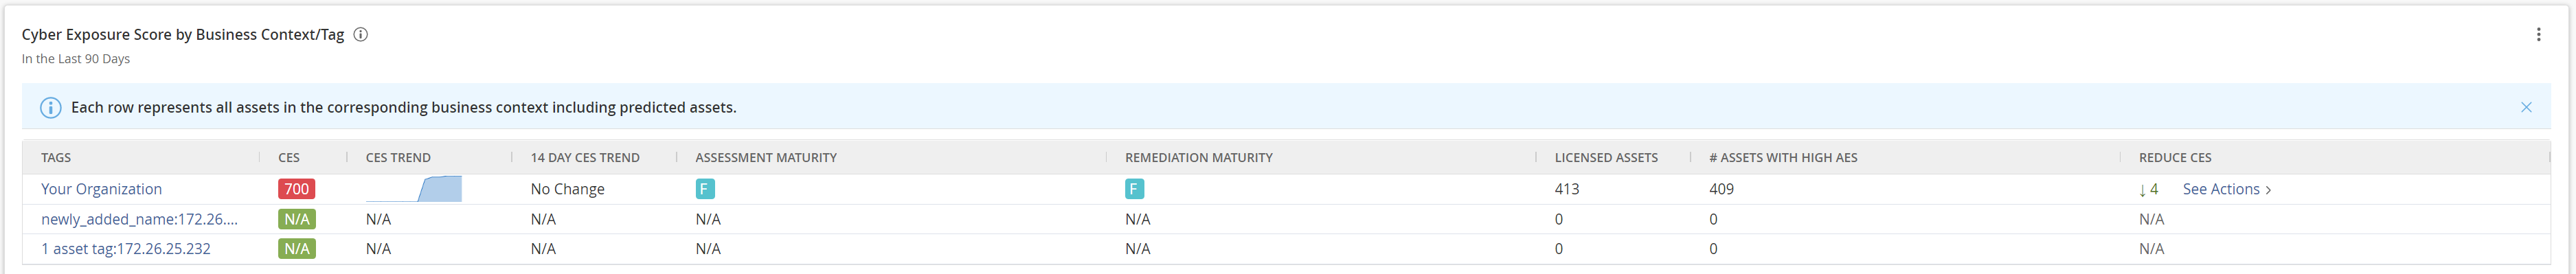
This widget summarizes data about the CES calculated for your entire organization and for assets with specific business context tags.
In this widget, you can perform the following actions:
- View data for the assets with each tag.
CES — The average CES for assets with the tag. A value of N/A indicates Tenable is calculating your CES.
CES Trend — A visual representation of your CES change over the past 180 days. A value of N/A indicates Tenable is processing your CES data or that there are 0 assets with this tag.
14 Day Trend — A summary of how the CES increased (
 ) or decreased (
 ) in the past 14 days. A value of N/A indicates Tenable is processing your CES data or that there are 0 assets with this tag.
Assessment Maturity — The Assessment Maturity grade for assets with the tag. A value of N/A indicates there are 0 licensed assets with the tag.
To view details about your Assessment Maturity grade for assets with a specific tag, in the Assessment Maturity column, click the grade.
The Tenable Lumin Assessment Maturity page appears, filtered by the tag you selected.
Remediation Maturity — The Remediation Maturity grade for assets with the tag.
To view details about your Remediation Maturity grade for assets with a specific tag, in the Remediation Maturity column, click the grade.
The Tenable Lumin Remediation Maturity page appears, filtered by the tag you selected. For more information, see View Remediation Maturity Details.
Licensed Assets — The number of licensed assets with the tag.
# Assets with High AES — The number of assets with the tag and a high AES.
Reduce Tag CES — Your expected tag-level CES reduction if you resolve all the solutions for assets with this specific tag. A value of N/A indicates your expected reduction is 5 or fewer. Typically, you cannot significantly reduce your CES if many assets were scanned without authentication or if your assets are healthy and your risk is already low.
To view the recommended actions for assets with a specific tag, in the Reduce Tag CES column, click See Actions.
The Tenable Lumin Recommended Actions page appears, filtered by licensed assets and the tag you selected.
-
To view details about the assets with a specific tag, click a row of the table.
The Tenable Lumin Business Context/Tag Asset Details page appears. For more information, see View Business Context/Tag Asset Details.
-
To modify the tags that appear in the widget:
- Click the
 button.
 -
Click the
 Configure button.
The widget editor plane appears.
-
Do one of the following:
-
To reorder the tags in the widget:
-
Click and hold the
button next to the tag you want to move. -
Drag the tag to the new location.
-
Release the mouse button to drop the tag in the new location.
-
- To delete a tag from the widget, click the
 button.
 -
To add a tag to the widget, click the
 Add Tag button and specify the tag you want to add.
 This widget can show data for up to 25 tags.
-
-
Click Save.
Tenable Vulnerability Management refreshes the widget.
- Click the
- To sort the table, see Tables in Tenable Vulnerability Management.