View Remediation Maturity Details
The following is not supported in Tenable FedRAMP Moderate environments. For more information, see the Tenable FedRAMP Product Offering.
Required Additional License: Tenable One / Tenable Lumin
Required User Role: Basic, Scan Operator, Standard, Scan Manager, or Administrator
Tenable calculates a dynamic Remediation Maturity grade that represents your overall vulnerability remediation responsiveness and coverage. For more information, see Remediation Maturity.
To view Remediation Maturity details for all assets:
-
In the upper-left corner, click the
 button.
 The left navigation plane appears.
- In the left navigation plane, click Remediation Maturity.
The Remediation Maturity page appears.
-
(Optional) To change the tag filter applied to the page, in the upper left corner, select a tag from the drop-down list.
Tenable Lumin filters the page by the tag you selected.
Note: All Tenable Lumin data reflects all assets within the organization's Tenable Vulnerability Management instance.
| Section or Widget | Timeframe | Assets | Action |
|---|---|---|---|
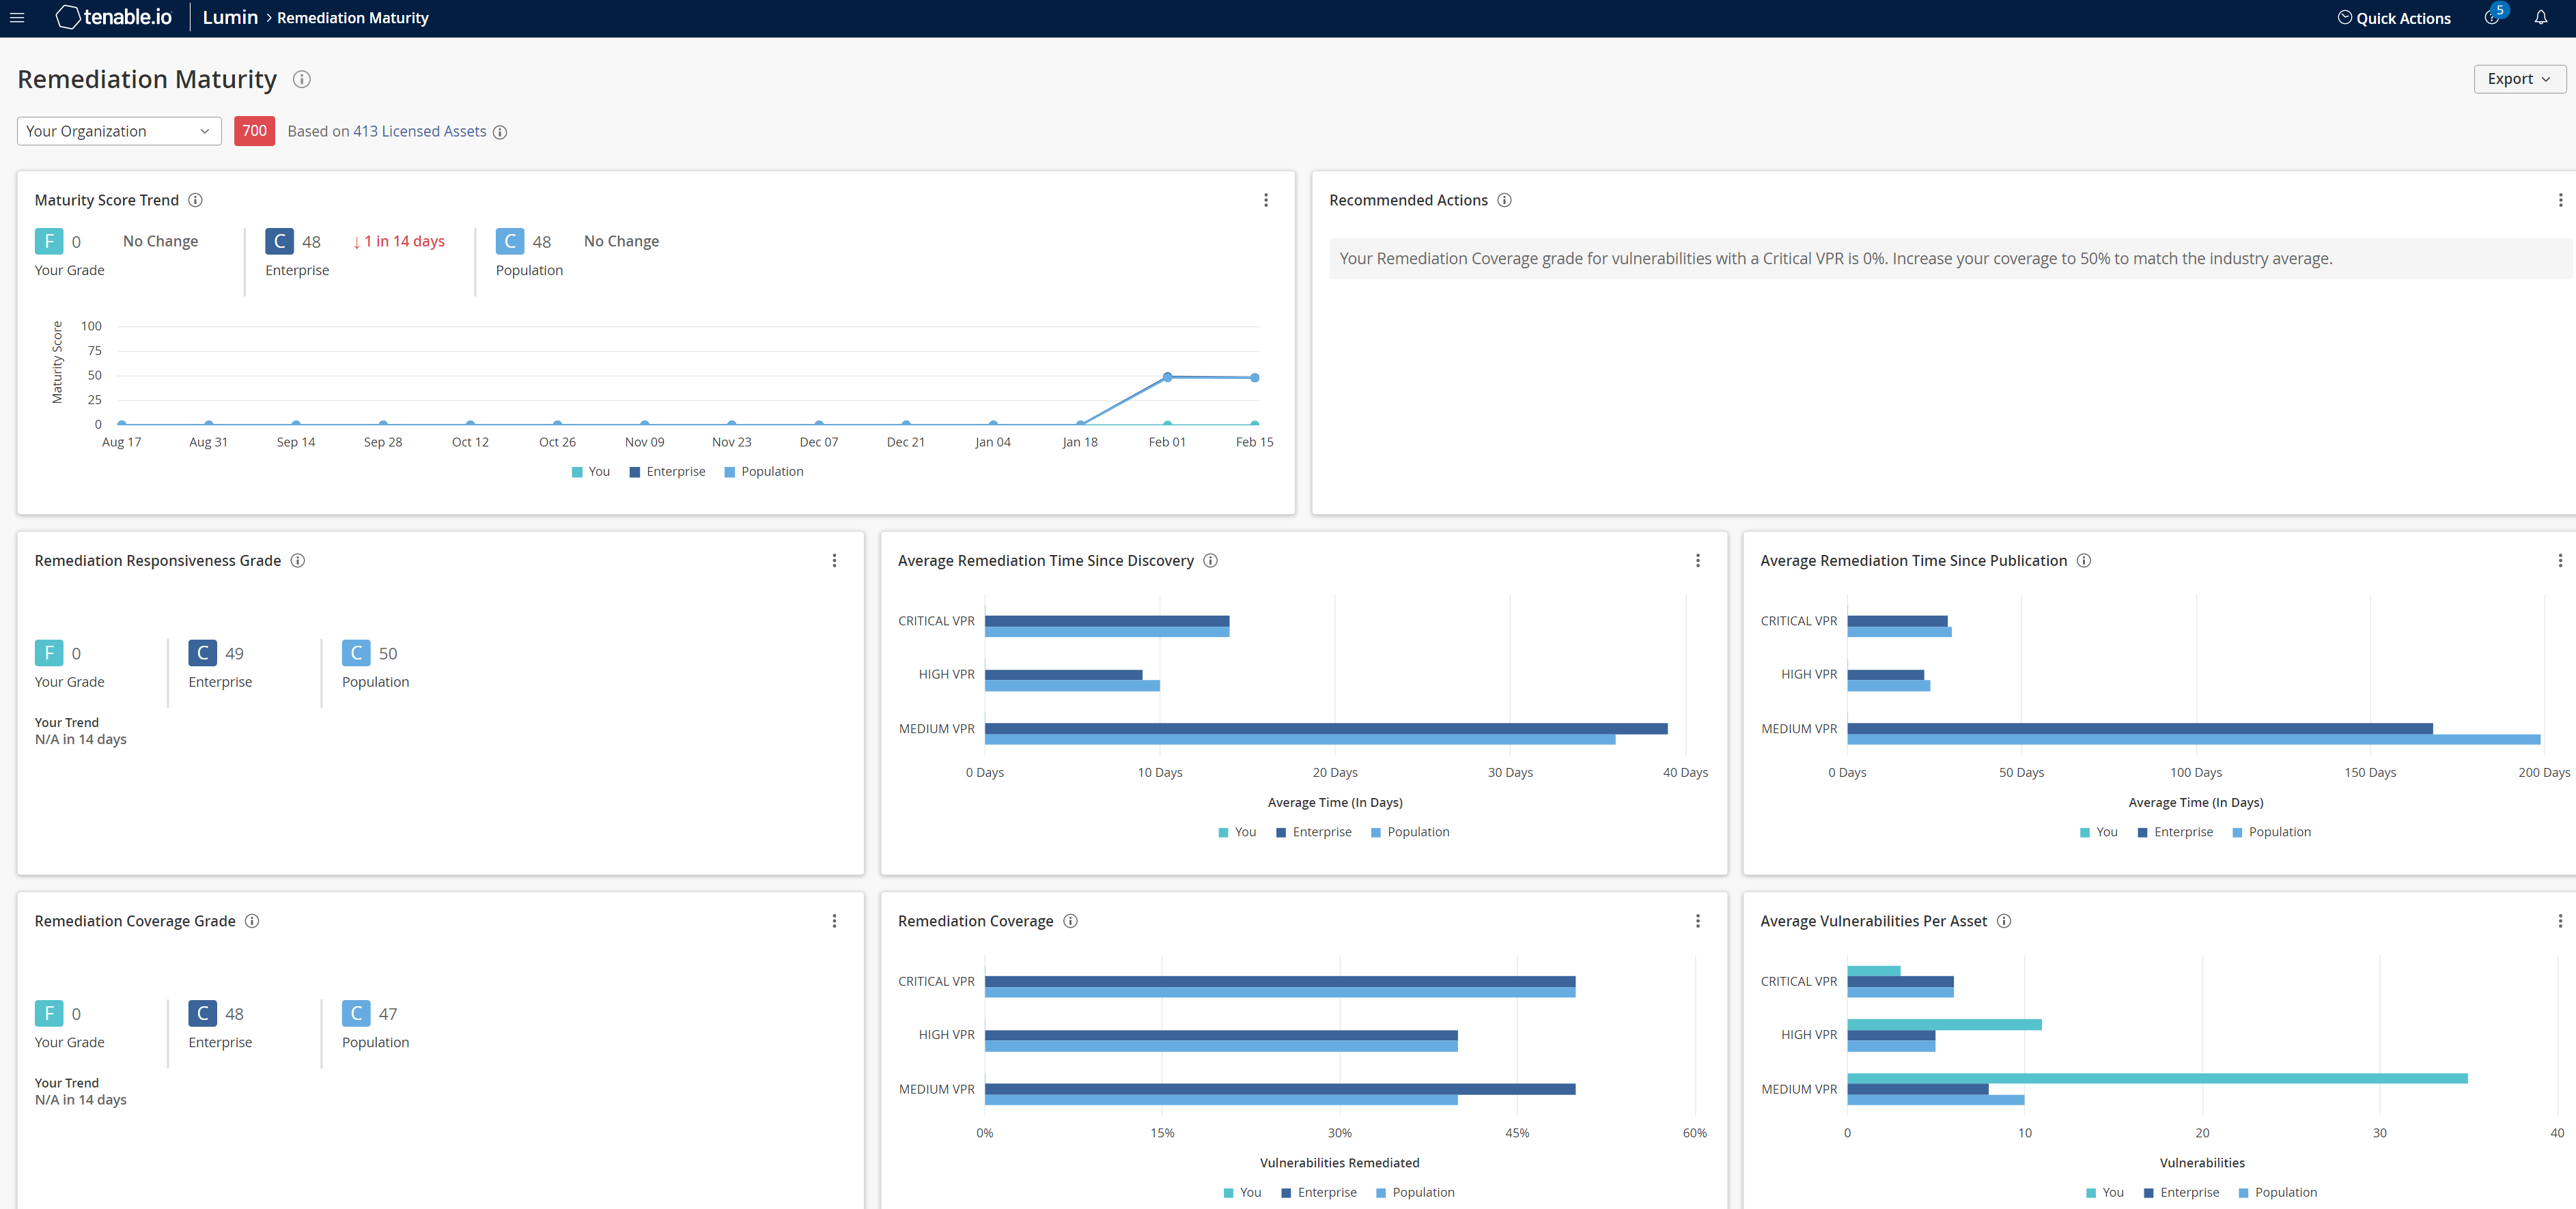
| Summary | Past 90 days | Licensed assets |
This section summarizes your Remediation Maturity grade, compared to Tenable customers in your Salesforce industry and the larger population.
|
|
Maturity Score Trend How is your Remediation Maturity grade changing over time? |
Past 90 days at each point on the graph, recalculated daily | Licensed assets |
This widget graphs the increases and decreases to your Remediation Maturity grade and to the average Remediation Maturity grade for Tenable customers in your Salesforce industry and the larger population.
|
|
Recommended Actions What general actions can you take to improve your remediation health? |
Past 90 days | Licensed assets |
This widget provides Tenable-recommended best practices to improve your remediation health.
|
| Remediation Responsiveness Grade
How quickly are you remediating vulnerabilities? |
Past 90 days | Licensed assets |
This widget summarizes the Remediation Maturity remediation responsiveness grade for your entire organization, compared to Tenable customers in your Salesforce industry and the larger population.
|
| Average Remediation Time Since Discovery
How long does it take you to remediate a vulnerability after it is first discovered (the First Seen date)?
|
Past 90 days | Licensed assets |
This widget graphs the average time, in days, you took to remediate vulnerabilities in each VPR category after the vulnerability was first discovered, compared to Tenable customers in your Salesforce industry and the larger population.
|
| Average Remediation Time Since Publication
How long does it take you to remediate a vulnerability after a plugin is first made available (the Plugin Publication date)? |
Past 90 days | Licensed assets |
This widget graphs the average time, in days, you took to remediate vulnerabilities in each VPR category after a plugin was first made available, compared to Tenable customers in your Salesforce industry and the larger population.
|
| Remediation Coverage Grade
How thoroughly are you remediating vulnerabilities? |
Past 90 days | Licensed assets |
This widget summarizes the Remediation Maturity remediation coverage grade for your entire organization, compared to Tenable customers in your Salesforce industry and the larger population.
|
| Remediation Coverage
What percentage of your vulnerabilities are remediated? |
Past 90 days | Licensed assets |
This widget graphs the percentage of your vulnerabilities that are remediated (fixed) in each VPR category, compared to Tenable customers in your Salesforce industry and the larger population.
|
| Average Vulnerabilities Per Asset
How many vulnerabilities, on average, are present on an asset? |
Past 90 days | Licensed assets |
This widget graphs the average number of vulnerabilities (active, fixed, or resurfaced) in each VPR category present on your assets, compared to Tenable customers in your Salesforce industry and the larger population.
|