Code CI/CD
This is a how-to guide about viewing and analyzing scan results in Tenable One Cloud Exposure.
- For an integration guide about connecting/configuring CI/CD pipelines to Tenable, see Connect CI/CD.
- For an overview of CI/CD and code capabilities in Tenable, see Code.
Use the Cloud Exposure Console to scan your code, analyze scan results, and identify any potential issues that arise. For each scan (sorted by time, and the repository it was performed on), you can see a breakdown of the number of issues found according to severity.
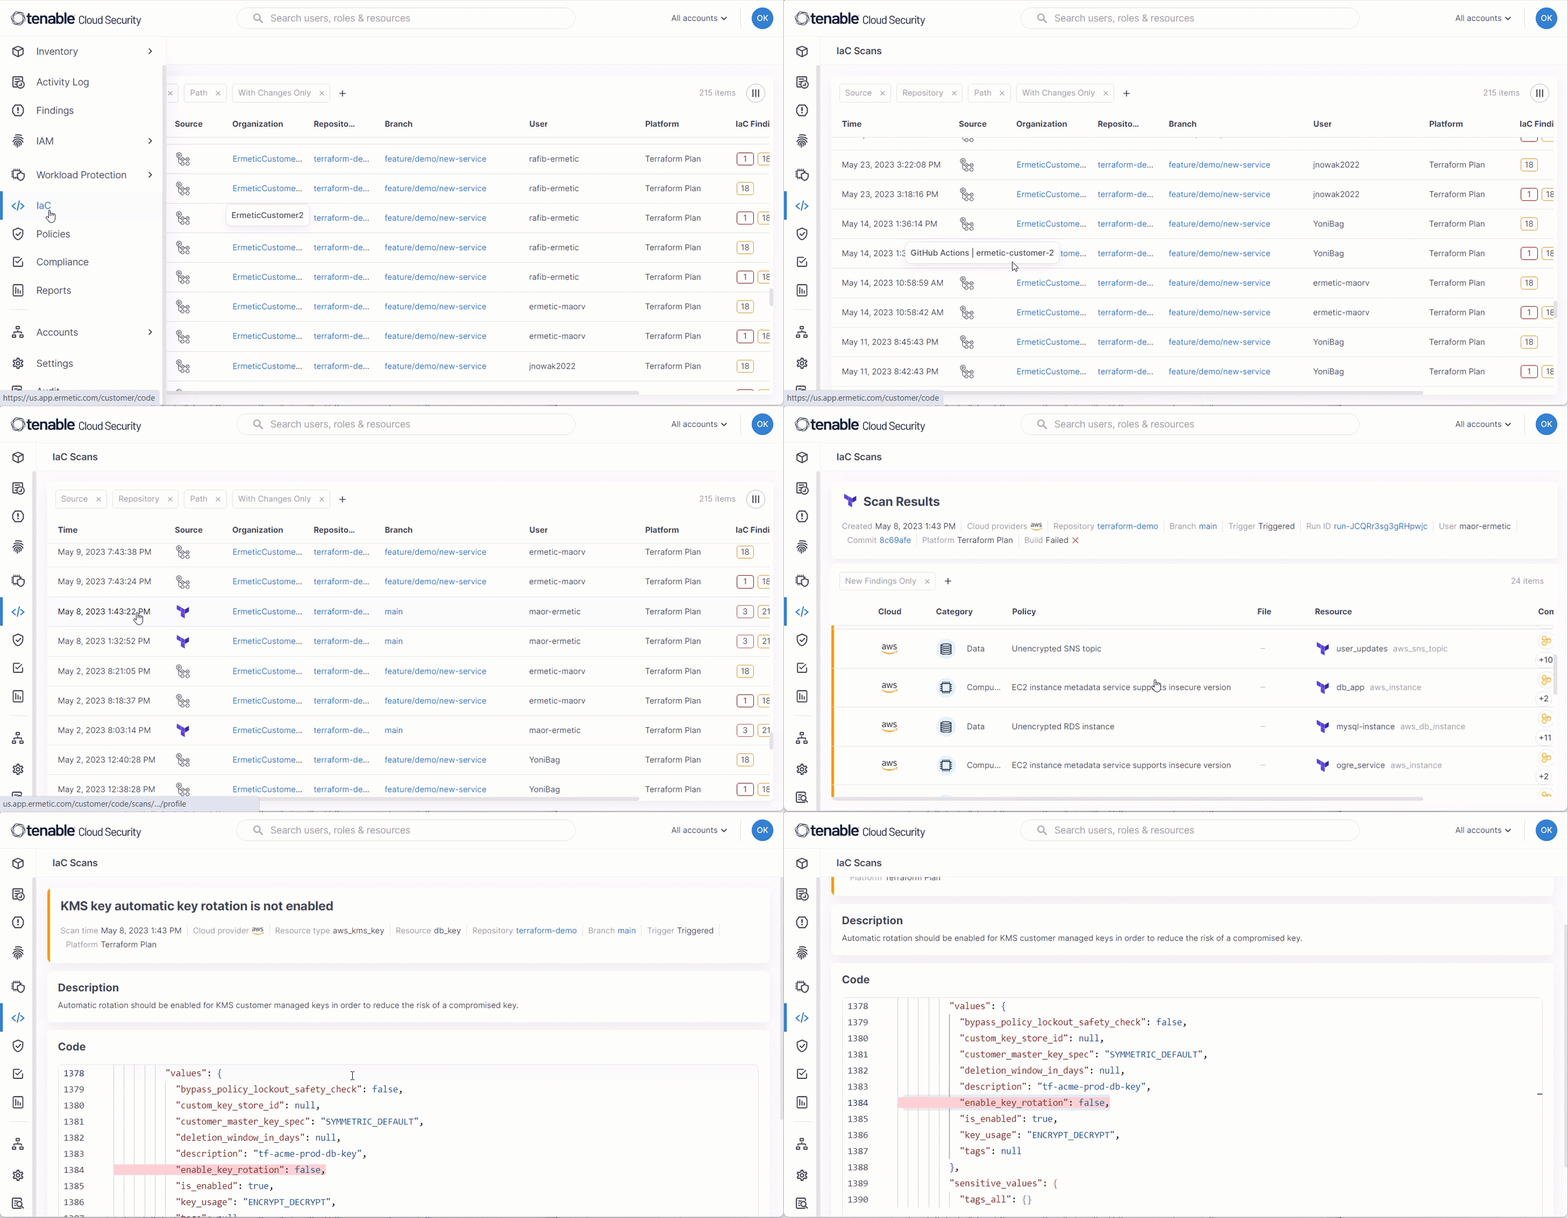
Get Started
Scan your code to detect and fix issues in configuration files.
Prerequisites:
- Ensure that your Terraform environment or CloudFormation template is set up.
- Review the IaC Compatibility Matrix to see which platforms/tools are supported for each IaC feature.
To get started:
- Connect your IaC to Cloud Exposure to scan your code:
- Configure Scan Settings to fine-tune how Tenable scans your environment, including, for example, which policies are used in scans.
- If you want to run a scan locally, without sending results to Tenable, see Run Scan Locally.
- After the scans are complete, use the Cloud Exposure Console to IaC Findings.
Run Scan Locally
If you want to run a scan locally (without sending results to Cloud Exposure), you can do so by only including a subset of the listed environment variables in the relevant pipeline step. The remaining variables listed in step 3 of the Add a Different Pipeline wizard are not needed when running a scan locally, since they are used to catalog and display relevant data in the Cloud Exposure Console.
To run a scan locally:
- In the Cloud Exposure Console, navigate to Settings > Integrations and click on Generic (Docker).
-
Click Lets Start.
Note: If you already configured a pipeline, click Add pipeline (Docker). -
Create an API token (Step 1 in wizard). Enter a name for the token, and then click Next to create the token.
Note: You can use the same API token for multiple machines. - Store the API token (Step 2 in wizard). Copy and store the generated token in a secure location. You will need it for the next step in the wizard. When finished, click Next.
-
Add environment variables (Step 3 in wizard). Add the following environment variables in the relevant pipeline step to report results to Tenable.
- The variables listed in the wizard are not needed when running a scan locally, since they are used to catalog and display relevant data in the Cloud Exposure Console.
- If you want to share scan context, and display relevant data in the Cloud Exposure Console, you can configure any flags included in the Tenable docker image, including global flags, as environment variables to further fine-tune scan settings. See Use Flags as Environment Variables for more information, including how to convert a flag for use as a variable.
CopyTENABLE_API_TOKEN='--api-token here--' # Replace with the value displayed in the add-pipeline wizard
TENABLE_API_URL='https://{region}.app.ermetic.com'Where the value you enter for region depends on the value in the URL you use to log in to the Tenable One Cloud Exposure Console. See Product Security and Privacy.
When finished, click Next.
-
Run Docker commands (Step 4 in wizard). To scan your container images, add the following step to your pipeline, adjusting it as necessary for your environment. The TENABLE_API_TOKEN field is sensitive, and should be treated as a secret.
Copydocker run --workdir /tmp/tenable --volume </home/user/code>:/tmp/tenable --env-file environment.variables --pull=always tenable/cloud-security-scanner:latest iac scanImportant: Be aware that the example step above assumes the following:- You're using docker run to run Tenable’s scanner in a container.
- The code you are scanning is located in /home/user/code.
- You have created a Docker env file named environment.variables.
- You're running a scan with the default flags.
- When done, click Finish.
Organization Hierarchy
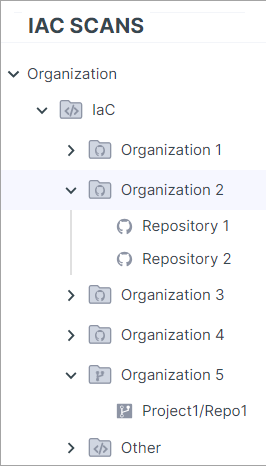
For Cloud Exposure code scan results, you can see the hierarchy of IaC organizations where your code is managed, together with any repositories they contain. Such organizations can come from GitHub, GitLab, Bitbucket, or Azure DevOps. Tenable extracts relevant organization and repository data and maps it accordingly. If for some reason Tenable can't extract organization data, the repository will be mapped to an Other folder at the bottom of the hierarchy. The mapping and resulting hierarchy is performed automatically by Tenable and can't be manually configured or adjusted.
Tenable only scans repositories with IaC resources, allowing you to better focus on those IaC tenants that actually have IaC resources. Repositories without IaC resources wont appear in the IaC hierarchy here, but will still appear in Settings > Accounts > IaC (with a status indicating that there are no resources).
View Scan Results
To view scan results:
-
In the Cloud Exposure Console, click on Risk > Code Scans. The Code CI/CD Scans page displays all scans performed by Tenable across your pipelines/repositories.
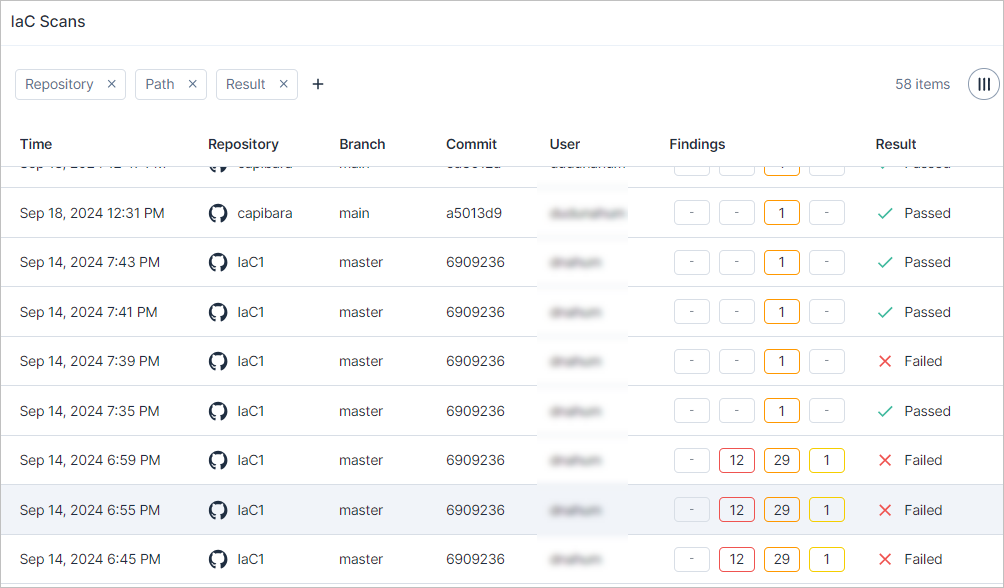
- Filter the table to narrow the scope of the visible data. See IaC Scans Column Data for more information.
-
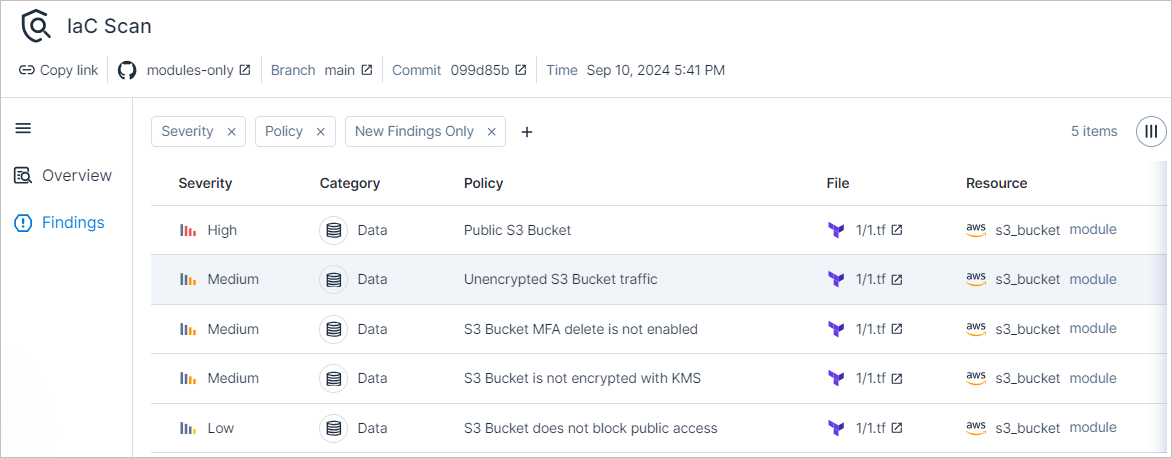
Click on an entry to see more information about a specific scan. The IaC Scan slideout is displayed. Click the Findings tab to see a list of all findings identified in the scan.
-
Filter the findings table to narrow the scope of the visible data:
- Click New Findings Only on the top of the table to filter the table by IaC findings that were found since the previous scan.
-
Click on a finding to drill-down into a specific issue. From here, you can see a summary and description of the finding, as well as the specific piece of code where the finding was found, for the entire affected resource.
Depending on the type of finding, Tenable will highlight the code, as follows:
- Issue: Missing global configuration. For example, VPC Flow Logs or CloudTrail, which need to be configured on the account level. Highlight: First line of the main file.
- Issue: Missing flag in a resource. For example, a flag that enables encryption is missing. Highlight: The line where the resource is defined or the first line of the object where the flag is missing.
- Issue: Misconfigured flag value. For example, an inbound address range of 0.0.0.0/0 Highlight: The specific line where the resource is misconfigured.
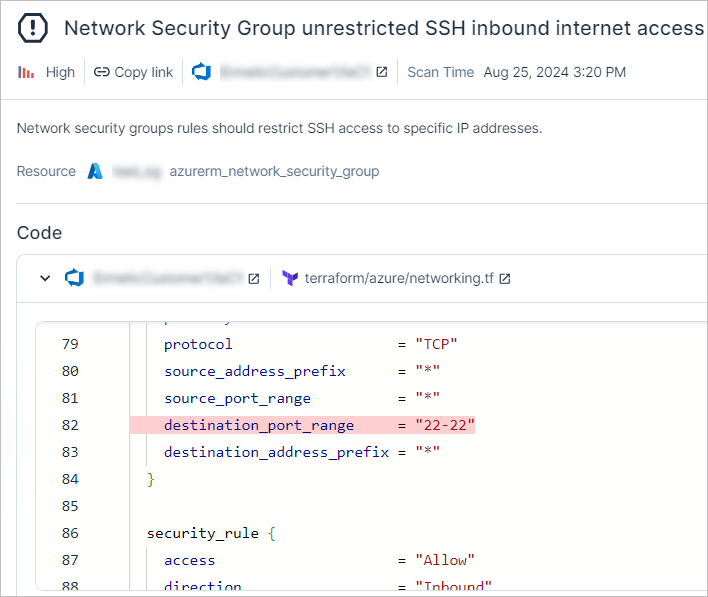
Code Scans Column Data
The following columns appear in the table on the Risk > Code Scans page, and most of them can also be used to filter data in the table.
| Filter | Description | Default |
|---|---|---|
| Time | The date and time that the scan was performed. | Yes |
| Repository | The name of the repository scanned by Tenable. | Yes |
| Branch | The name of the branch that was scanned. | Yes |
| Commit | The number of the commit. | Yes |
| Author |
|
Yes |
| Findings | A breakdown of the number of IaC findings found, by severity level. | Yes |
| Result | Whether the scan workflow passed or failed, based on scan configuration for the minimum policy severity that should fail the build. | |
| Framework | The type/s of file that were parsed, and for which Tenable returned results. Possible values: CloudFormation, Terraform Code, Terraform Plan. See Supported IaC Tools for more information. | No |
| Integration |
The integration name of the scanned code:
|
No |
| Path | The repository path that was scanned by Tenable. For Terraform Cloud, the value is null, since the scan is performed by Tenable within the context of a run task, and not within the customer's environment. | No |
| IaC Scanned Resources | The number of IaC resources that were scanned by Cloud Exposure. | No |
| Trigger | The action that triggered the scan. | No |
Scan Results Column Data
The following columns appear in the table on the Scan Results page (after you drill down into the results of a specific scan), and most of them can also be used to filter data in the table.
| Filter | Description |
|---|---|
| Cloud | The cloud service provider (CSP): AWS, Azure, or GCP |
| Category | The policy category of the policy. |
| Policy | The name of the Tenable policy that maps to, and that triggered, the IaC finding. See IaC Policies for a list of all policies used in IaC security scanning. |
| File | A link to the Terraform code or plan file scanned by Tenable. For Terraform Cloud, the value is null, since the scan is performed by Tenable within the context of a run task, and not within the customer's environment. Note: Links to files may not work if the working directory is not the root directory of the repository. |
| Resource | The cloud resource affected by the IaC finding. |
| Resource Type | The cloud resource type affected by the IaC finding. |
| Standards | Compliance standards and security best practices that map to policy benchmarks. |
| NEW |
Indicates whether this IaC finding is new (was not detected in previous scans), to help you quickly identify differences between scans, and address potentially unsolved IaC finding.
|
Export IaC CI/CD Scan Results
Export IaC CI/CD scan results to a CSV file. The data is exported according to the current filters applied to the table, and contains all the table columns (visible or hidden).
To export IaC CI/CD scan results:
- Go to Risk > Code CI/CD.
- (Optional) Select a code tenant in the Organization drop-down to view policies that are relevant to a specific subset of cloud accounts. By default, the entire Organization (all organizations/repositories) is selected.
- Filter the table to narrow the scope of the visible data.
- From the top-right corner of the table, click the Export
 button.
You can also export a single CI/CD scan result:
- Go to Risk > Code CI/CD.
- (Optional) Select a code tenant in the Organization drop-down to view policies that are relevant to a specific subset of cloud accounts. By default, the entire Organization (all organizations/repositories) is selected.
- Click on a specific scan in the table to open the scan result.
- On the left-hand pane, click on Findings.
- From the top-right corner of the table, click the Export button.