Create a Custom Trending Widget
Required User Role: Basic, Scan Operator, Standard, Scan Manager, or Administrator
In Tenable One Vulnerability Management, you can create custom trending widgets to track findings or asset data over time. Each trending widget displays up to five trend lines, each with its own dataset and filters. Tenable One Vulnerability Management calculates trend data once per day, accumulating up to 90 days of data from the date the widget is saved. There is no backfill of historical data.
To create a custom trending widget:
- Do one of the following:
- Create a custom trending widget via the widget library:
- View the widget library.
In the upper-right corner of the page, click
 New Custom Widget.
The Create Custom Widget page appears.
Create a custom trending widget while editing a dashboard:
- Edit a dashboard.
- In the upper-right corner of the page, click Add Widgets.
A menu appears.
Click
New Custom Widget.
The Create Custom Widget page appears.
- Create a custom trending widget via the widget library:
-
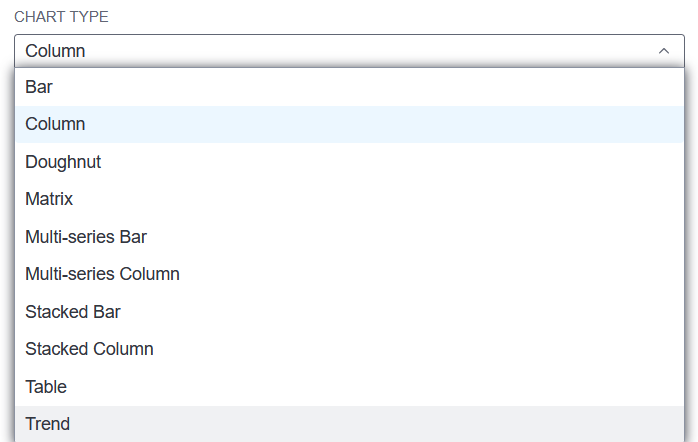
In the Chart Type drop-down, select Trend.
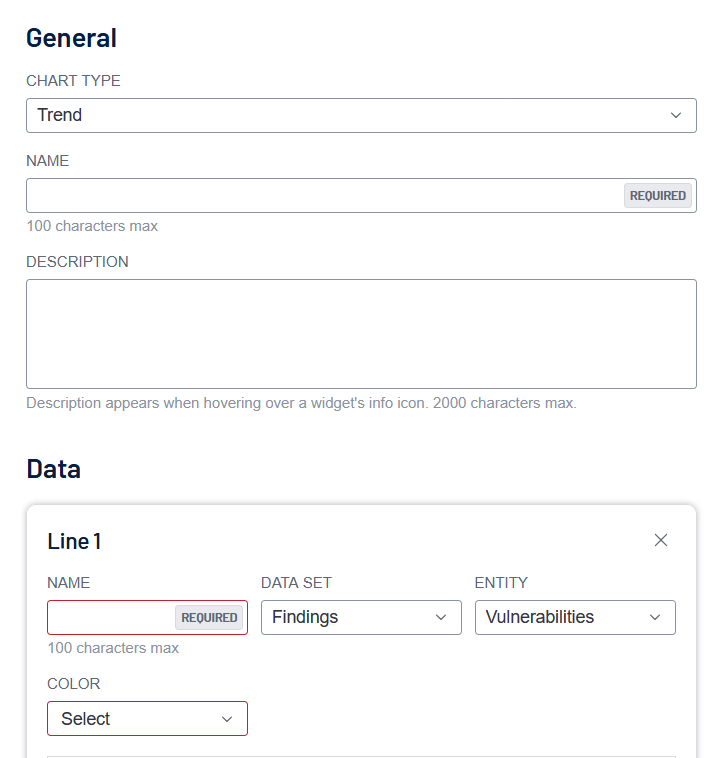
The page updates to show the General and Data configuration sections.
-
In the Name box, type a name for the widget (100 characters max).
-
(Optional) In the Description box, type a description for the widget (2000 characters max).
Note: The description appears when hovering over the widget's info icon on a dashboard.
-
In the Data section, configure the first trend line:
- In the Name box, type a name for the trend line (100 characters max).
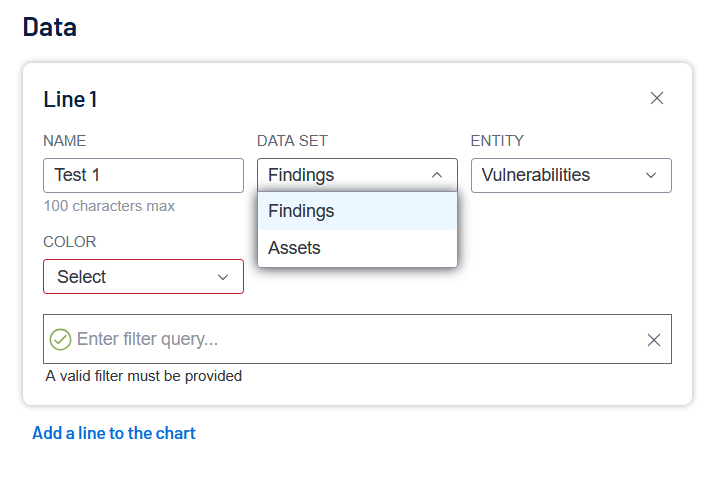
- In the Data Set drop-down, select Findings or Assets.
- In the Entity drop-down, select an entity type.
- In the Color drop-down, select a color for the trend line.
- (Optional) In the filter query box, type a filter query to scope the data for this trend line.
-
(Optional) To add more trend lines, click Add a line to the chart and repeat the previous step.
-
Click Save and Exit.
Tenable One Vulnerability Management saves the widget to the widget library, and you can add it to any user-defined dashboard.
Note: The widget preview shows a static image and does not reflect live data. Trend data begins accumulating from the day the widget is saved.
Note: Dashboard filters do not apply to trending widgets. Filters are defined per trend line when you create or edit the widget.
Note: Event lines appear on the chart when one of the following occurs:- The widget configuration is updated.
- A trend line's filters are changed.
- The widget is deleted.
Tenable Trending Widgets
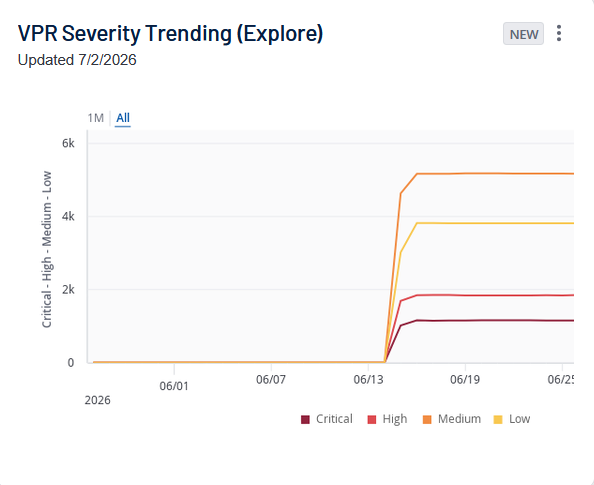
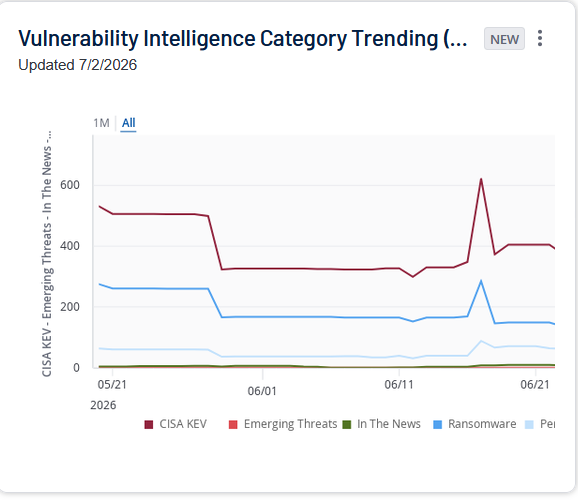
Tenable One Vulnerability Management includes pre-built trending widgets that you can add to your dashboards. Unlike custom trending widgets, data collection for Tenable trending widgets begins when you add the widget to a dashboard, not when it is created.
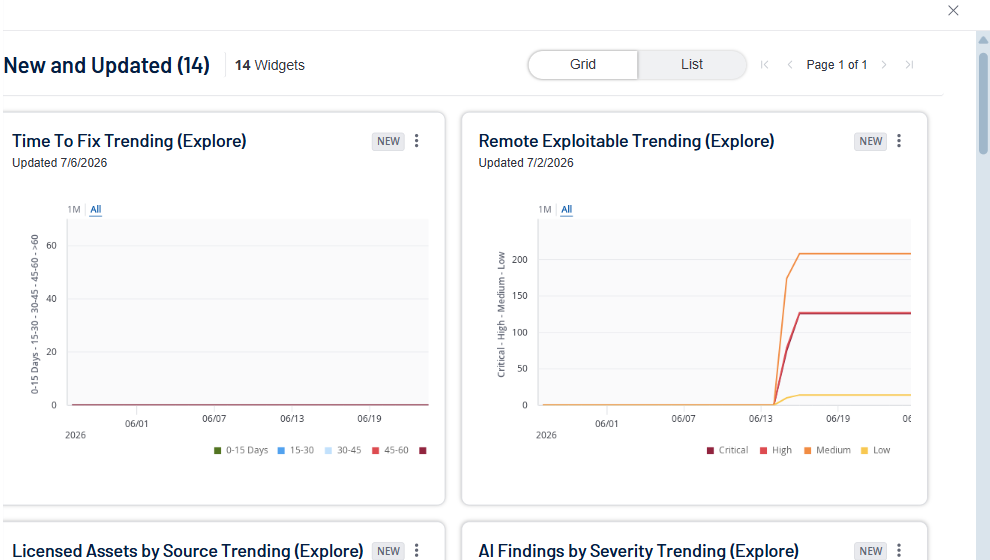
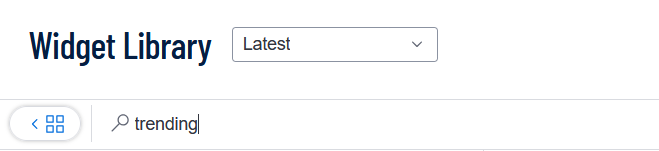
To see all available Tenable trending widgets, view the widget library and search for trending in the search bar.
Limits
| Scope | Maximum |
|---|---|
| Trend lines per widget | 5 |
| Trending widgets per container | 100 |
| Custom trending widgets per user | 30 |